

The market decline Monday was accompanied by 2282 declining stocks and only 825 advancing stocks. The McClellan oscillator, a short term A/D indicator, has been diverging from prices March 21st and broke to new correction lows with Monday's close (see Tweeted chart) . The A/D lines are still in positive trends with no signs yet of a top.
The Spyder Trust (SPY) now has short term support at $204.20 and the 20 day EMA. The monthly pivot stands at $202.28 which is about 2% below current levels. The expected correction in crude has taken it below the 38.2% support level as the short positions in crude oil has dropped over 30% since it peaked early in the year (Time To Squeeze The Short Oil Speculators?)
The longer term technical outlook does suggest that the correction in crude oil will set up a good buying opportunity as once again traders are building up their short positions in crude oil. Recent fundamental reports are adding to the bearish sentiment.
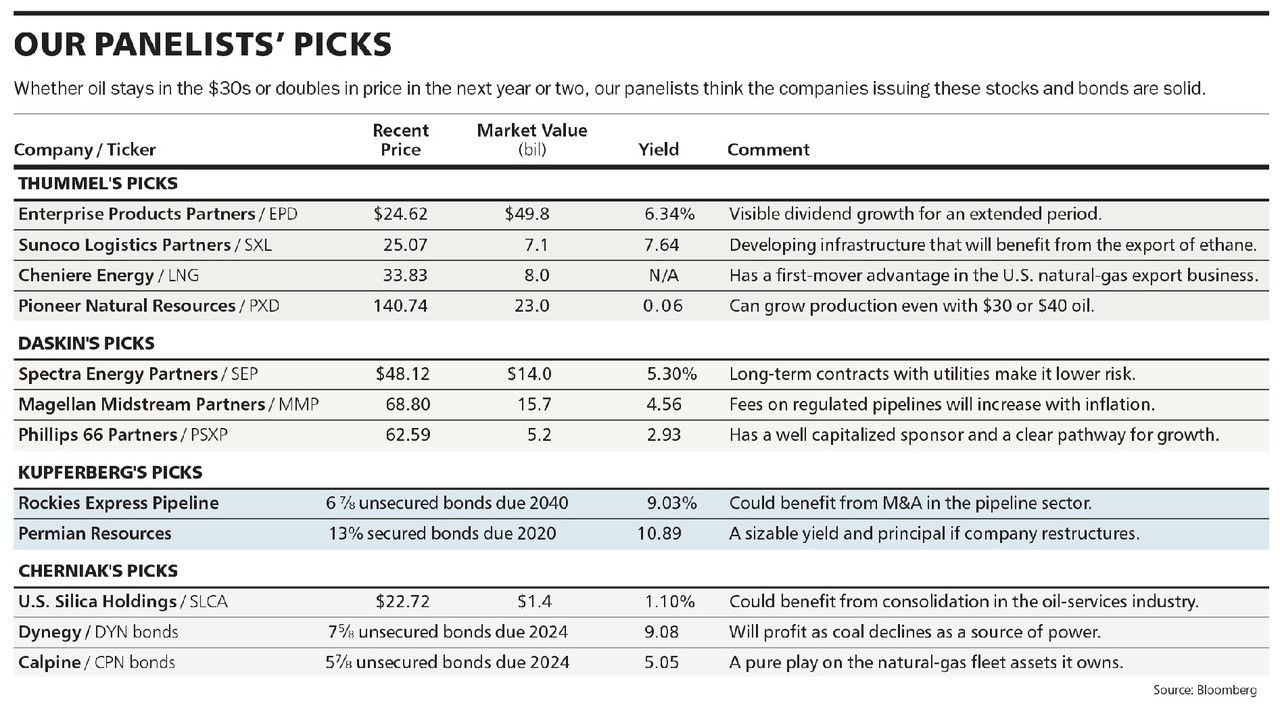
Therefore I found the recent Barron's column "Energy Roundtable: 12 Oil Rebound Picks" quite interesting. The four energy experts were not particularly optimistic on the energy markets but did give their favorite recommendations in both stocks as well as distressed debt as shown in the table above. Of the six stocks three are starting to act stronger than the Spyder Trust (SPY) and have bullish volume patterns.
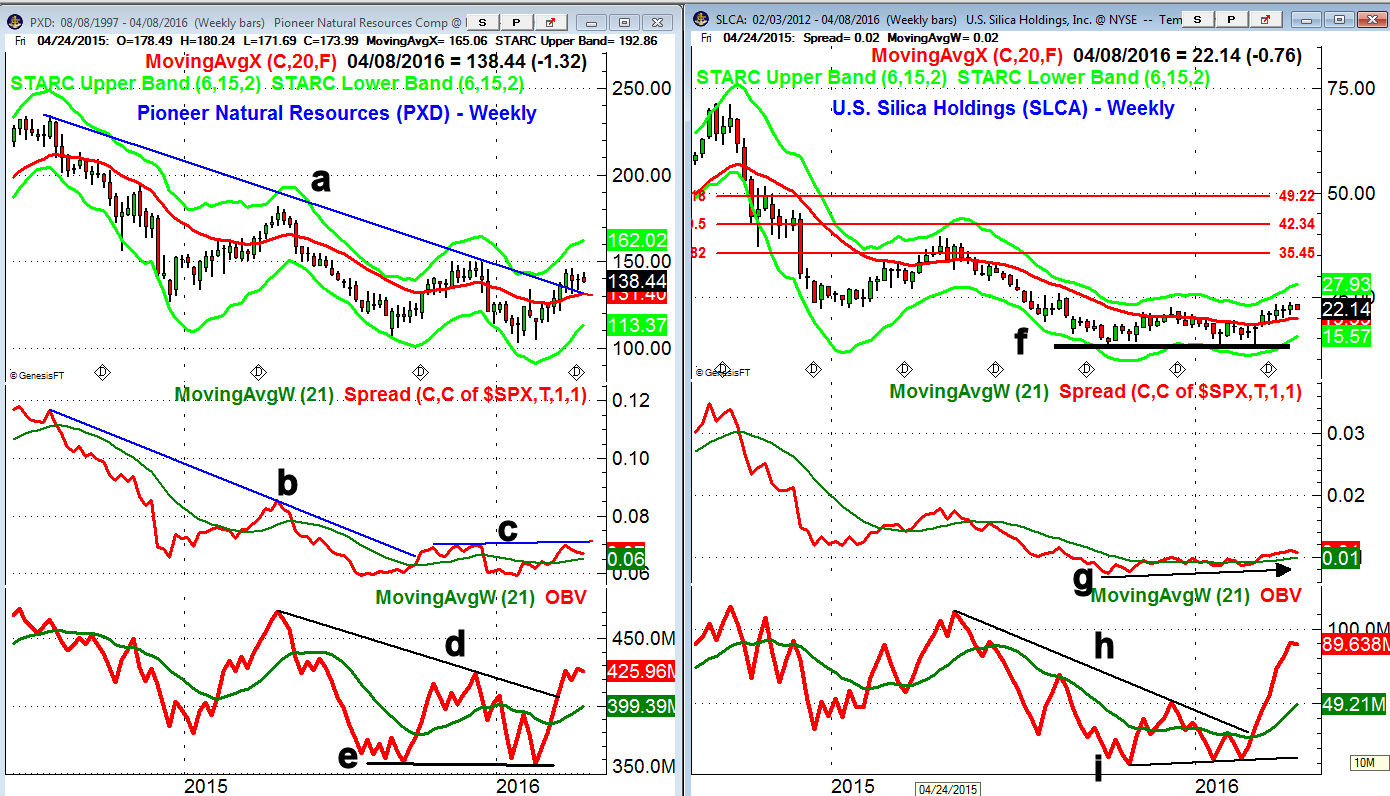
Pioneer Natural Resources (PXD) is a $22.5 billion oil and gas exploration company that peaked at $233.95 in June 2014 and had a low in January of $103.47.
- The weekly downtrend, line a, was broken four weeks ago with next major resistance and the swing high at $150.
- The monthly pivot and initial support is at $135.56 with the quarterly pivot at $130.04.
- The weekly relative performance moved through its long term downtrend, line a, in October.
- The RS line did not make a new low with prices in January and now needs to move through resistance at line c, to complete its bottom formation.
- The weekly on-balance-volume (OBV) made marginal new lows with prices, line e.
- Though there was not a bullish divergence the move in the OBV through the downtrend, line d, was a sign of strength.
- A decline in the OBV back to its rising WMA would likely coincide with a buying opportunity.
U.S. Silica Holdings (SLCA) is a $1.38 billion dollar industrial metal & minerals companies whose silica products are used in fracking and oil & gas recovery.
- SLCA has been holding above its 20 week EMA, now at $20.00, for the past six weeks,
- The weekly starc+ band is at $27.96 with the major 38.2% retracement resistance at $35.45.
- The 20 day EMA is at $21.07 with the quarterly pivot at $19.99.
- The weekly chart shows a potential double bottom formation, line f.
- The weekly RS line formed higher low, line g, and has moved barely above the prior high.
- This is consistent with a bottom suggesting that SLCA is starting to become a market leader.
- The weekly OBV has moved strongly through its downtrend, line h, indicating strong accumulation.
- The higher lows in the OBV (line i) and the surge above the previous high is a bullish sign.
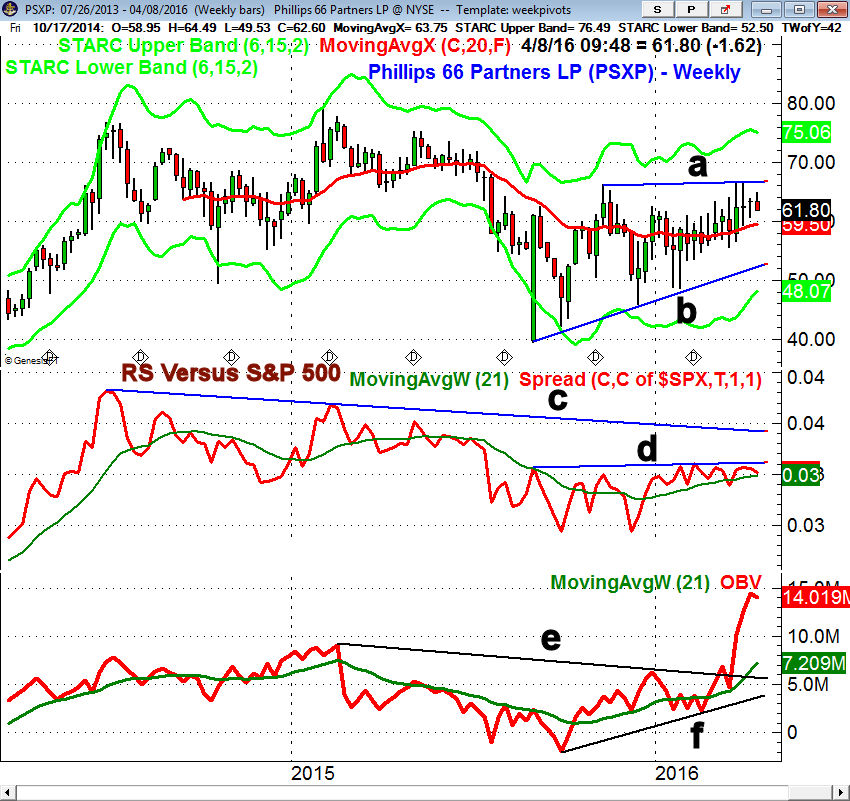
Phillips 66 Partner LP (PSXP) is a $5.13 billion growth-oriented master limited partnership formed by Phillips 66 to own, operate, develop and acquire pipelines and terminals.
- The rally three weeks ago stalled at weekly resistance, line a, in the $66.80 area.
- There is stronger resistance in the $70 area with the weekly starc+ band at $75.11.
- The quarterly pivot is at $59.47 with stronger weekly support in the $54-$56 area.
- The relative performance has not been able to move above the resistance at line d.
- The RS line has further resistance at the major downtrend, line c.
- The weekly OBV shows a strong uptrend from the October 2015 lows, line f.
- In early March the OBV staged a major breakout by moving through the resistance from early 2015 at line e.
What to do? With crude oil reaching first good support we could see a rebound over the near term. The technical studies, including the HPI, which uses open interest and volume suggests it may form a more complex bottom over the next week or so. I would be looking for a pullback to support in these three stocks and U.S. Silica Holdings (SLCA) looks the best.
Editor's Note: If you like Tom's analysis you might consider the Viper ETF Report as he covers both the energy sector and the crude oil ETFs like United States Oil (USO)
Comments
comments