

The eight down days in the Dow Industrials since the July 20th high was enough to cause many analysts to question the validity of the rally from the late June lows. Their focus had turned to the historically weak performance of stocks in August.
According to AAII the bullish % of individual investors has declined for four weeks in a row. A Seeking Alpha survey before Friday's job report indicated that only 3.5% were looking for big gains in employment while 27.9% were expecting a "downside surprise after June’s blowout number".
Needless to say the 255,000 surge in nonfarm payrolls caught many by surprise as those who ventured on the short side scrambled to cover their positions. The major averages gapped higher on the opening Monday and several were quickly at new highs.
Another push higher in the stock market is likely to add to the pains of the hedge fund industry. Since my July 2014 article “The Week Ahead: One Bubble Starting to Burst?” I have felt that the hedge fund bubble was bursting. As noted in a May CNN article it looks like the industry is now facing up to this reality.
As they noted "A barometer of hedge fund performance, called the HFRI Fund Weighted Composite Index, has generated an annualized gain of just 1.7% over the past five years. Compared to that, the S&P 500's average annualized return for the same period was 11%."
The majority of the hedge funds apparently rely on fundamental analysis to guide their investment decisions though some claim to use technical analysis for their timing. The current bull market may turn out to be the best argument in favor of technical analysis. The fundamental opinion was very negative at the correction lows in 2010, 2011, 2012 as well as February and it was the action of the A/D lines that signaled it was now the time to fight the tide and buy.
The one hedge fund strategy I have had the most problem with in the past ten years is the so-called macro strategy where positions, long or short, are taken based on the manager's analysis of the economic and political views of various countries. There are no hard rules for this analysis as more often it comes down to their opinion which in my view is often based on sometimes-dubious data.
One analyst I know stayed out of stocks for most of the bull market because of his concerns over China. I should point that there are several macro analysts who I think are very smart and insightful but it is the timing of their investments that I often question.
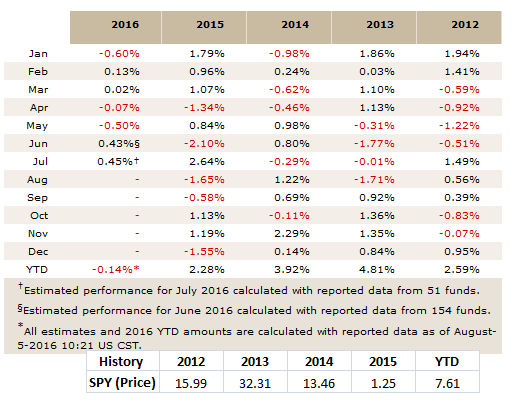
It should come as no surprise that these funds have not performed well since 2012 according to BarclayHedge. I have added in the performance for the Spyder Trust (SPY) from Morningstar so that it can be compared to the Barclay Global Macro Index.
The table shows that so far this year the SPY is up 7.61% while the Macro Index is down 0.14%. Only in 2015 did the macro funds do better as they had a 2.28% gain versus 1.25% by the SPY. In most other years the SPY has been much stronger as it was up 32.31% in 2013 versus only a 4.81% gain in the Macro Index.
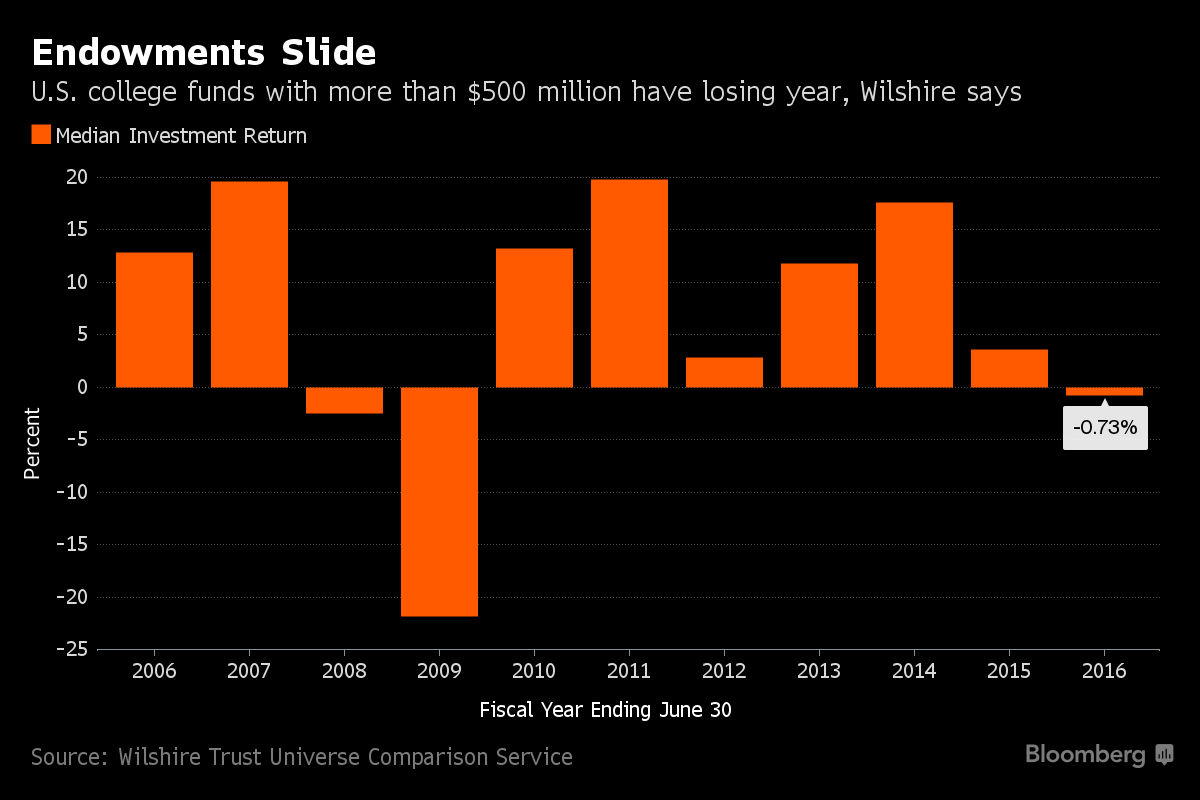
Many of the big name college endowment funds also invest in hedge funds and they have had a couple of rough years as this chart from Bloomberg indicates. Several Universities are starting to pull out of their hedge fund positions and a July study by Credit Suisse Group AG revealed that "Eighty-four percent of investors in hedge funds pulled money in the first half of the year".
I am doubtful that the interrelationship between the global stocks markets and their economies will ever again be clear enough for a macro strategy to be consistently profitable. In any case I would urge investors to adopt a technical approach to their investing and to avoid investing based on a macro economic view.
The strong close on Friday should move more of the reluctant market bears into the bull camp. In last week's column I thought that the new highs in the S&P 500, that were forecast by the A/D analysis in May, was starting to convince investors that the bull market was alive and well.
For the past two weeks I had avoided adding to long positions that were established just before June jobs report. At the start of last week there were signs that the correction was close to over and I made new buy recommendations for Viper ETF traders.
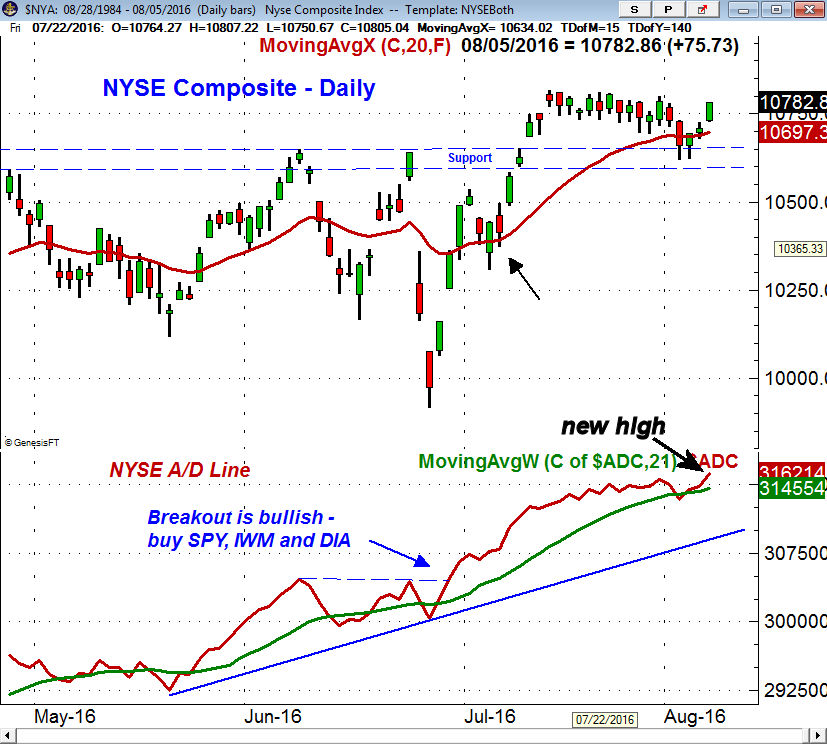
On Tuesday the NYSE Composite dropped into my support zone which suggested the worst of the selling could be over. The NYSE A/D line moved back above its WMA last Wednesday and Friday's gap higher turned the momentum clearly positive. The strong move in the A/D line above its WMA is consistent with the resumption of the uptrend.
Last week was full of earnings reports and while there were a number of high profile losers there were also some very nice winners as over the past few weeks there have been a number of stocks that were just starting to join the market's rally.
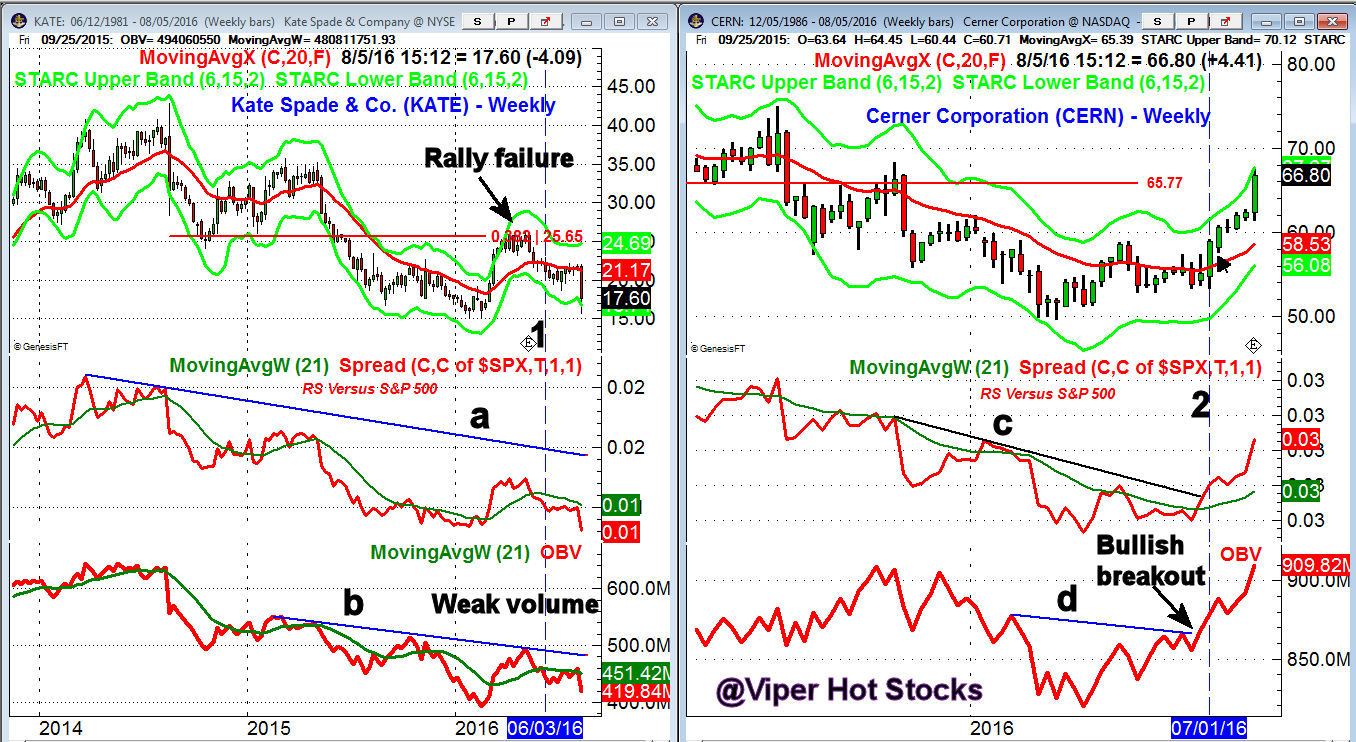
Kate Spade & Co. (KATE) was one of the week's big losers as it dropped 18.7% as its 2nd quarter earnings were very weak. The technical outlook for KATE had been negative since June 3rd (line 1). It had been acting weaker than the S&P 500 since early in 2015 as the relative performance has been in a downtrend, line a. The RS dropped below its WMA in early June which was a sign of weakness. The OBV was also very weak and the stock's rebound in 2016 failed at the 38.2% Fibonacci retracement resistance.
Cerner Corporation (CERN) was a different story as it appeared on the weekly Viper Hot Stocks buy list in early July (line 2) and was recommended on July 5th. The move in the RS line above its downtrend, line c, indicated that CERN was becoming a market leader. The weekly on-balance-volume (OBV) had broken out to the upside in late June as resistance (line d) was overcome. Before its earning last week traders took profits on 50% of the position and are giving the rest of the position some room on the upside.
The Economy
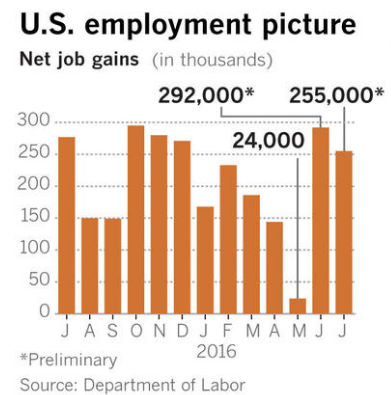
Many economists and the investors are changing their opinion on the economy after the monthly jobs report. The very weak report in May unfortunately frightened some investors out of the stock market just before it turned around. The data from the past two months has clearly broken the downtrend which makes the next several months important. It is always dangerous to place too much emphasis on any one data point.
Last week started off with the PMI manufacturing Index and ISM Manufacturing Index which came in at 52.9 and 52.6 as both are still well above the 50 level. Construction Spending was weaker than expected at -0.6%.
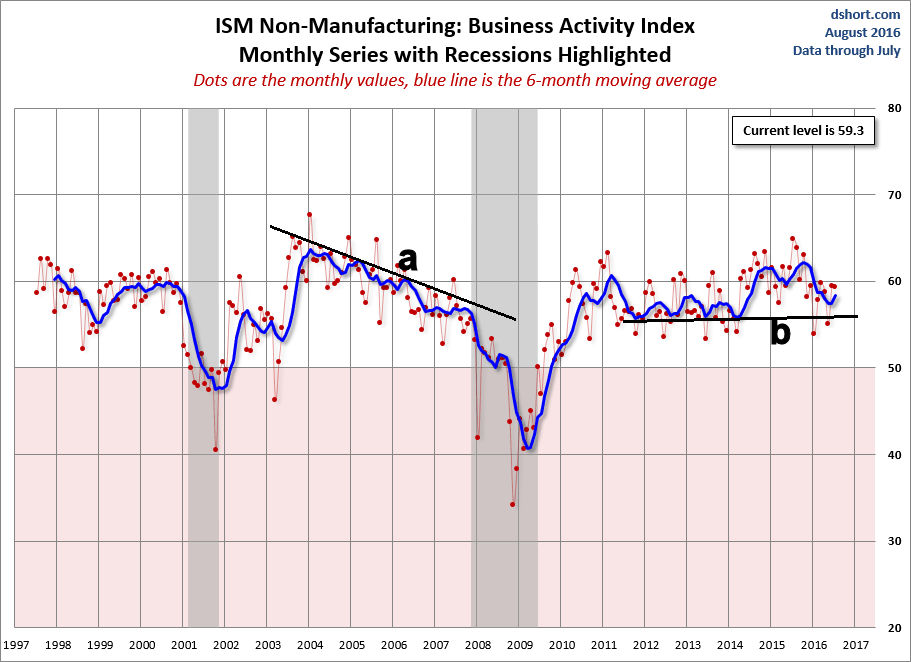
On Wednesday the ISM Non-Manufacturing Index and the PMI Service Index came in at 55.5 and 51.4 respectively as these two readings on the service sector continue to diverge. The long-term chart of the ISM Non-Manufacturing Index (from dshort.com) shows that the 6-month moving average (blue line) peaked in 2004 and declined for several years, line a, before plunging at the start of the last recession. There is now important support at line b which if broken would be a warning sign for the economy. Factory Orders on Thursday were negative for the second month in a row.
The economic calendar is light this week with Productivity and Costs on Tuesday followed by Import and Export Prices on Thursday. On Friday we have Retail Sales, PPI, Business Inventories and Consumer Sentiment.
Interest Rates & Commodities
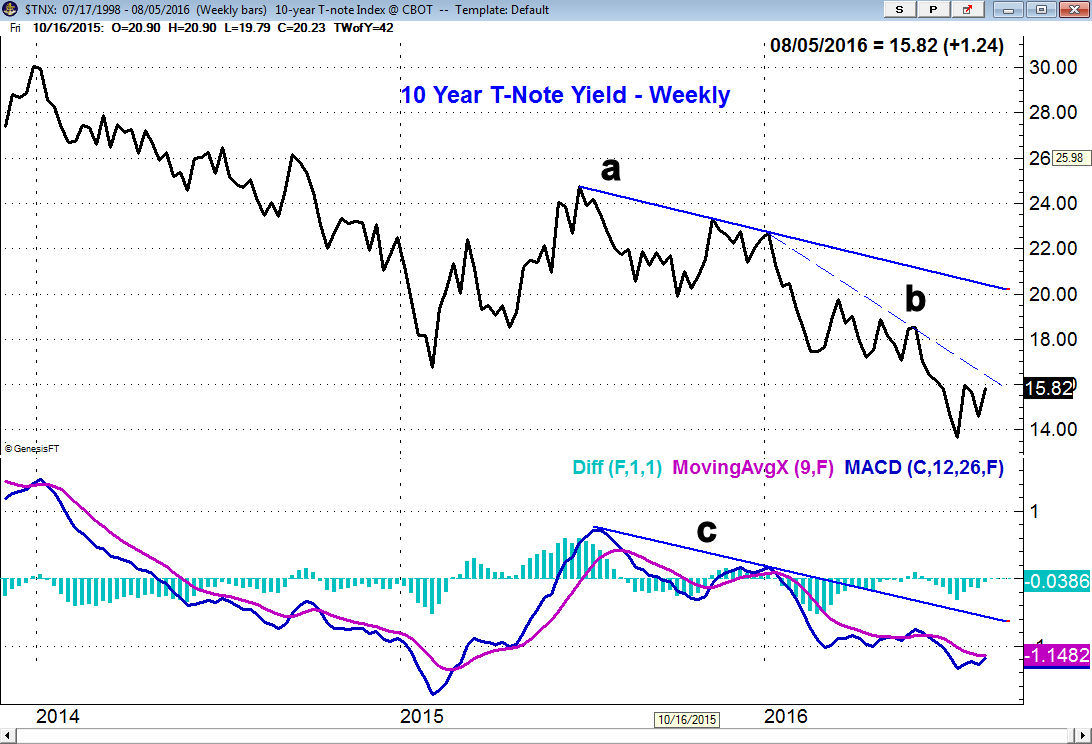
In reaction to the much stronger than expected jobs report the yield on the 10 Year t-Note jumped but is still below the downtrend, line a, in the 1.664% area. A daily close above the June high at $1.750% will keep the uptrend in yields intact. The daily MACD turned positive on July 13th and has again turned higher after pulling back. A move in the MACD above the resistance at line c, will reinforce the uptrend in yields.
Crude oil dropped below the $40 level last week before it rebounded. The daily studies, like the Herrick Payoff Index, have turned positive but the OBV is still negative. There is next key support for the October contract is in the $39 area. It is likely to take a few weeks before a bottom was confirmed by the weekly analysis.
Gold and the gold miners dropped last week but the burst of upside momentum the previous week suggested that the worst of the selling may be over. The short-term outlook does allow for further weakness and the extent of the selling will be watched closely. A test of the recent lows is possible.
Market Wrap
The strong rally Friday was enough to erase the weekly losses in most of the major averages. The Dow Industrials were up 0.60% while the S&P 500 gained 0.43%. The Nasdaq Composite led the way as it was up 1.1% and made a new all time high along with the S&P 500. The weekly Advance/Decline numbers were positive and were quite strong on Friday.
There are still few signs of extreme investor optimism as data from the Investment Company Institute reveal that $70 billion has flowed out of equity funds this year while $137 billion has moved into bond funds. According to AAII only 29.8% of individual investors are bullish.
There is now a long list of well-known billionaire investment experts that are bearish on stocks and one well-known media analysts turned bearish last Wednesday. This follows his similar bearish calls at other recent lows and as I mentioned in an early June commentary " Look Before You Leap" it is important that you look at an expert's past recommendations before you take their views too seriously.
Technology Stocks led the market higher gaining 1.6% and Friday's sharp gains pushed the financial stocks up 1.2% for the week. Oil and gas as well as health care managed very slight gains. Biotech was strong as one of the Viper ETF top picks, the SPDR S&P Biotech (XBI) was up 3.4%.
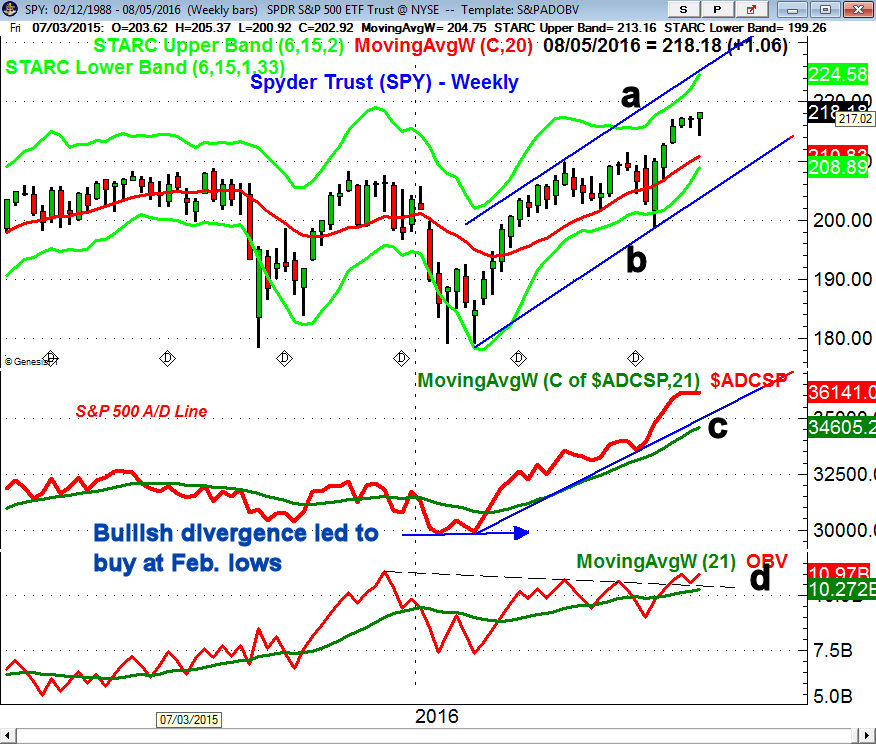
All of the major advance/decline lines except the Dow Industrials did make new highs last week. The weekly A/D lines like the S&P 500 are still making new highs and are bullish. The next resistance for the SpyderTrust (SPY) is in the $220 area with the weekly starc+ band and upper trading channel (line a) are in the $223-$224 area.
The weekly A/D line is still well above support at line c, and its rising WMA. The bullish divergence in the A/D line was instrumental in my February buy signal (Is There Blood In The Streets Yet?) The weekly OBV has turned up from the breakout level, line d, and still looks positive.
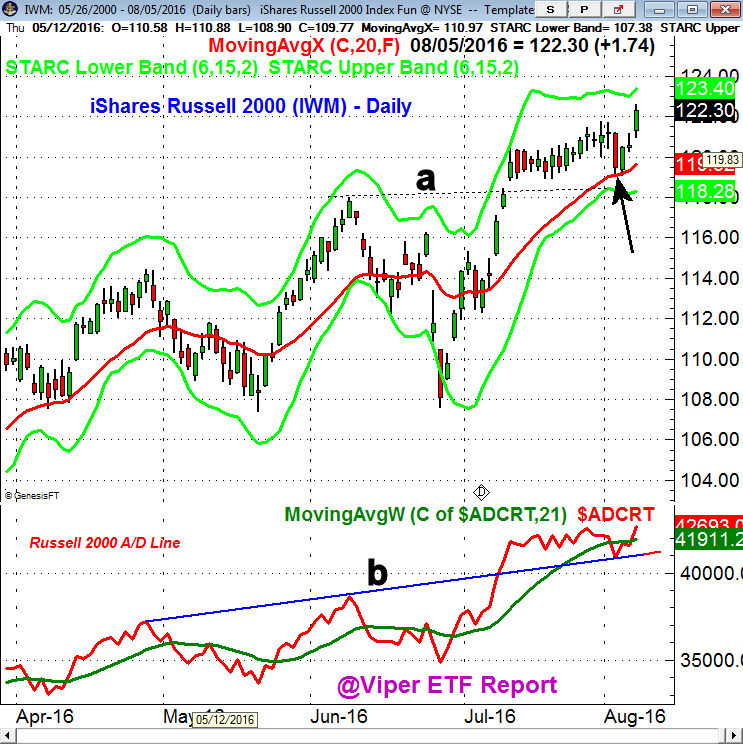
The iShares Russell 2000 (IWM) was up 1.4% on Friday as it had a classic pullback last week. The drop on Tuesday took IWM to the 20 day EMA but it held well above the support at line a. The breakout above this level in July was a very bullish sign and this former resistance is now good support. The Russell 2000 A/D line also dropped back to its support (line b) last week before turning higher. It made a new high on Friday.
What to do? Though I could not rule out a sharper correction last weekend I did think the "SPY is likely closer to a short-term low." The strong close Friday needs some follow through this week to confirm a resumption of the uptrend. The Spyder Trust (SPY) should test the $220 area and a rally to $222-$224 is clearly possible.
My view has been that this rally will be accompanied by an increase in bullish sentiment which is likely set the stage for a deeper correction as the bullish camp becomes a bit more crowded. The next correction could last a few weeks and it should provide a good opportunity for investors to add to their long positions.
As I suggested last week now is a good time to review your portfolio holdings to see if there are any holdings that are lagging the overall market. Using the relative performance is the best tool in my opinion and any cash you raise can be put back into the market this fall.
For traders following the Viper ETF Report I will be watching the rally closely as I will start to scale out of longs as the market moves higher. Regular reports are sent out twice a week but when needed special alerts are sometimes sent out during the market day. Several new long positions in specialized ETFS were established on last week's pullback
If you are a stock trader I typically make 1-3 new recommendations each week on either the long or short side in the Viper Hot Stocks Report. It is also updated twice a week and each service is only $34.99 per month. The subscriptions can be cancelled on line at any time.
Comments
comments