

It was a rough week overall for global investors and the comments from the FOMC made things worse not better. The focus prior to the Fed meeting had been on what the long term impact of negative bond yields could have on the world's economy and whether voters in the UK would decide to leave the European Union.
The Fed's concern over the health of the US economy and the polls that currently suggest that UK citizens now favor leaving have heaped more pressure on the indecisive investor. In last week's AAII survey the bullish% dropped to 25.4% and is now further below its long term average.
Though it is difficult to really assess the professional sentiment we do know that many high profile hedge fund managers are expecting a sharp market decline. Based on commentary in the financial media and blogs it does not seem many are looking for higher prices.
As I cover in more detail in the Market Wrap section the stock market looked ready to complete its correction in the middle of last week but it did not generate enough positive momentum to signal that the market had turned the corner. This may happen this week but the spike in the VIX is a sign that the fear trade is the most popular now.
The possible exit of Greece from the Euro zone monetary union had been a concern during most of the market corrections since the bull market began. In each instance I thought it was unlikely as the economic costs with the common currency were too high.
In 2010, 2011 and 2012 it was even more important that the technical analysis of the US stock market indicated that they were just corrections and not warnings of a major top. The fear trade did not work then as many sold their long positions near the market lows. I would argue that it is not the best trade for most right now.
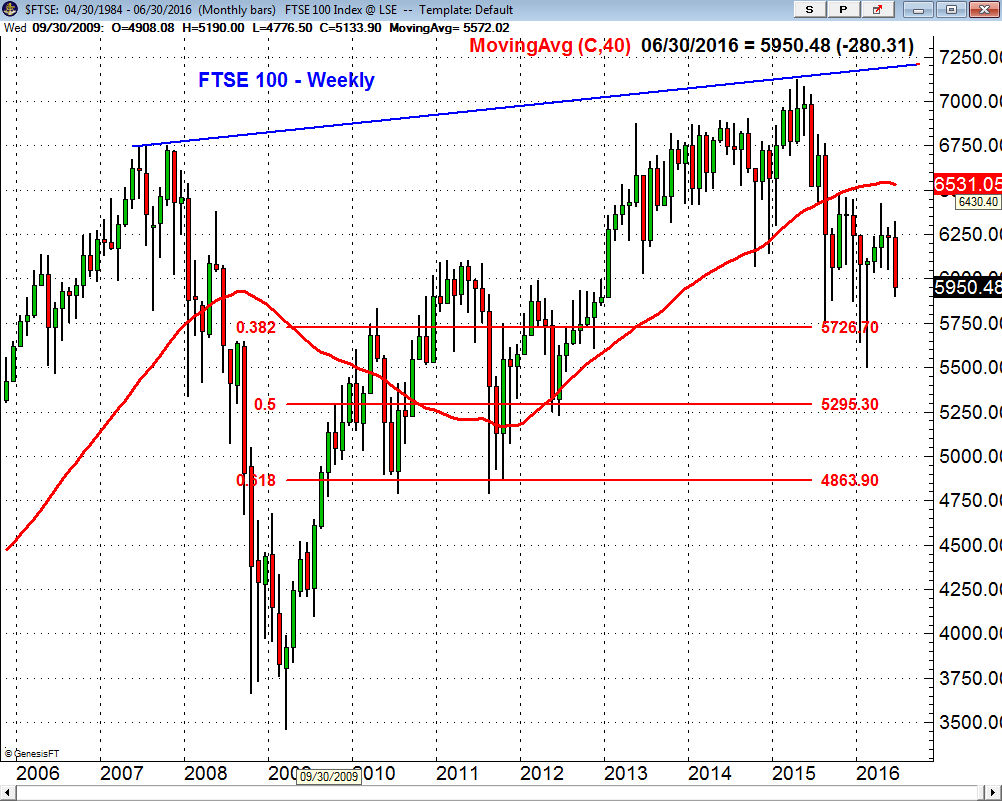
The United Kingdom's stock market, the FTSE 100, has failed to rally much from the lows early in the year. Tt does look weaker that the major Euro zone markets. The correction did take the FTSE 100 between the 38.2% and 50% support levels before it bounced. The close last week was below the prior three-week low which is a sign of weakness. This suggests that no matter how the vote turns out their market could stay weak.
The senseless and apparently politically motivated murder of Jo Scott, a member of parliament who supported staying in the European Union could cause a shift in sentiment. My concern over the vote is not tied to how investments may do for the rest of 2016 but is more a concern of what it might mean to global politics in the years ahead. Historically periods of nationalism and isolation have often led to periods of conflict and war.
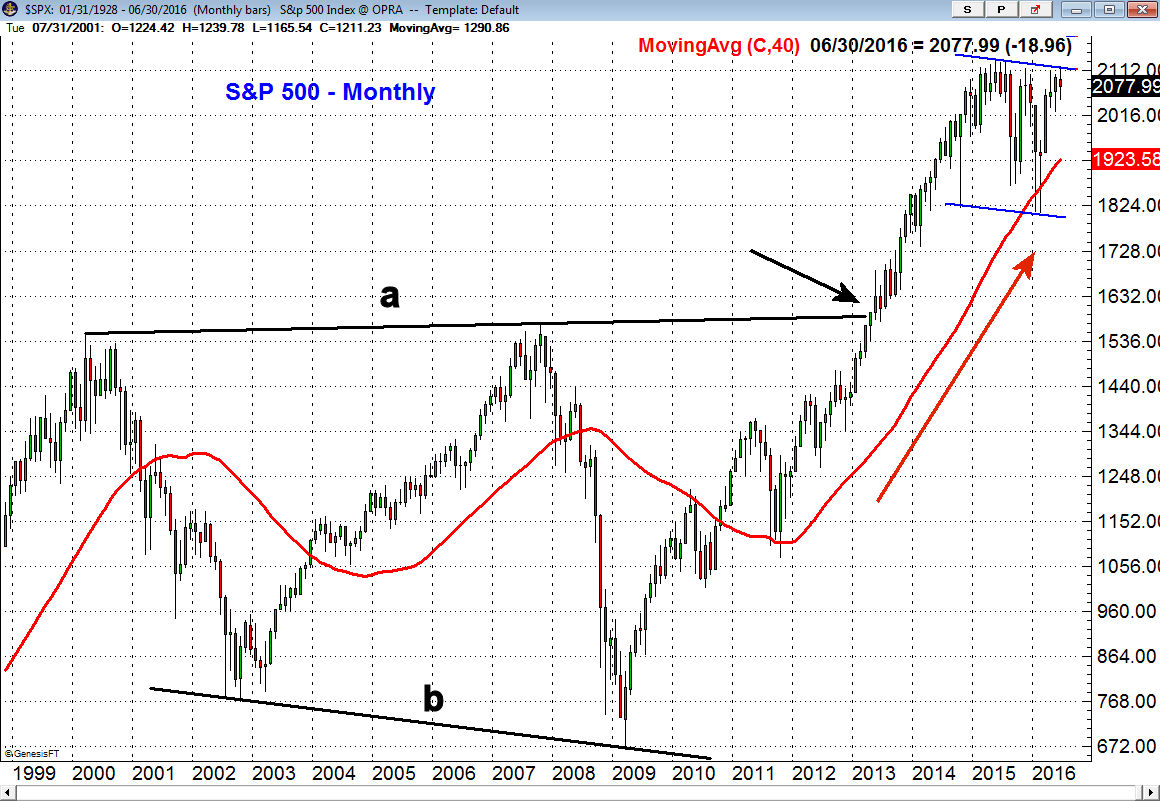
When some look at the long-term chart of the S&P 500 they focus on the trading range (blue lines) that has been in effect since the latter part of 2014 which some interpret as a major top formation. That of course could be the case but the new highs in the monthly S&P 500 A/D line suggest that it is just a major pause in the overall uptrend.
In terms of the long-term market trend I think that the S&P 500's breakout of the major trading range in 2013, lines a and b, is more significant. The width of the trading range has major upside targets in the 2400-2500 area. Though a retest of the breakout level at 1600 is always possible before the upside targets are met it will take many months before the 40-month moving average tops out.
The FOMC comments on inflation suggested they expect it to stay low and below their target level of 2% for some time yet the Market Vectors Gold Miners (GDX) rallied sharply after the FOMC announcement. It opened strong Thursday but then closed lower and was lower for the week. Still it is the long-term picture that looks more interesting.
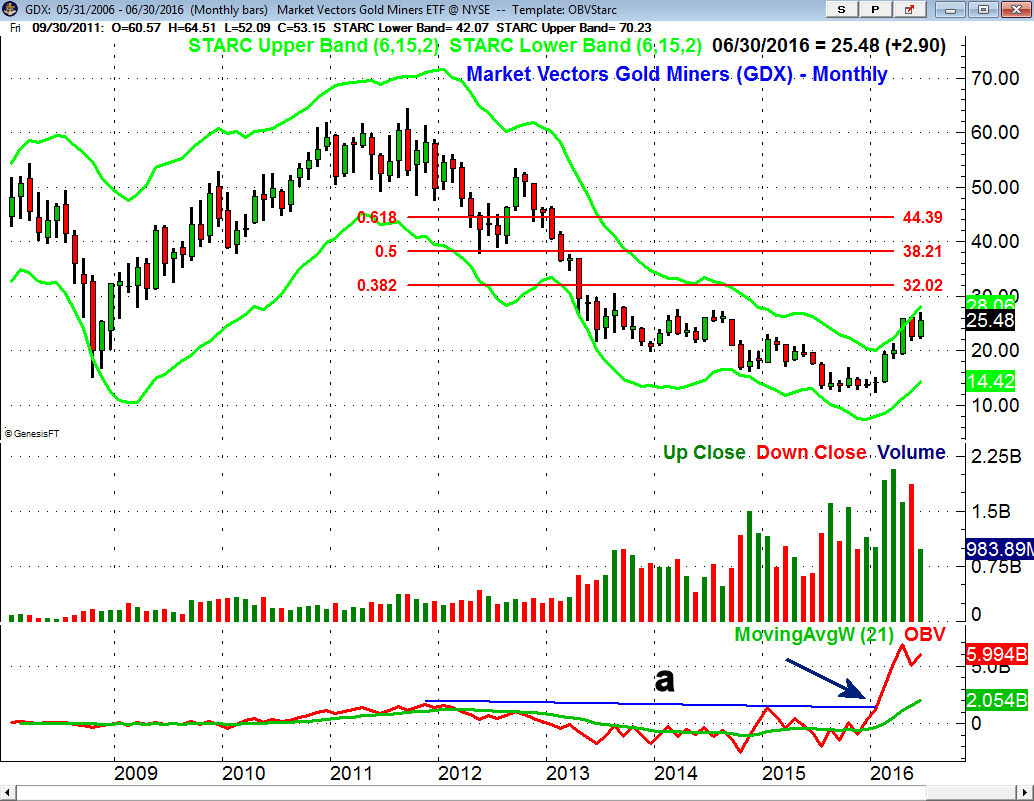
The monthly chart shows that GDX has been testing its starc+ band for the past three months. GDX formed double dojis in December and January that was followed by a doji buy signal in February. The major 38.2% Fibonacci retracement resistance is at $32.02 which is almost 25% above current levels. (if you are interested in learning more about Fibonacci analysis a new Viper Trading lesson was sent out on Friday and is provided to all new clients)
The monthly on-balance-volume (OBV) broke through major resistance, line a, at the start of the year as the volume the first three months of the year was quite heavy. The OBV is still clearly positive but the weekly OBV (not shown) has now formed a negative divergence. This increases the chances of a further correction that should be another buying opportunity as gold typically has a seasonal bottom in July.
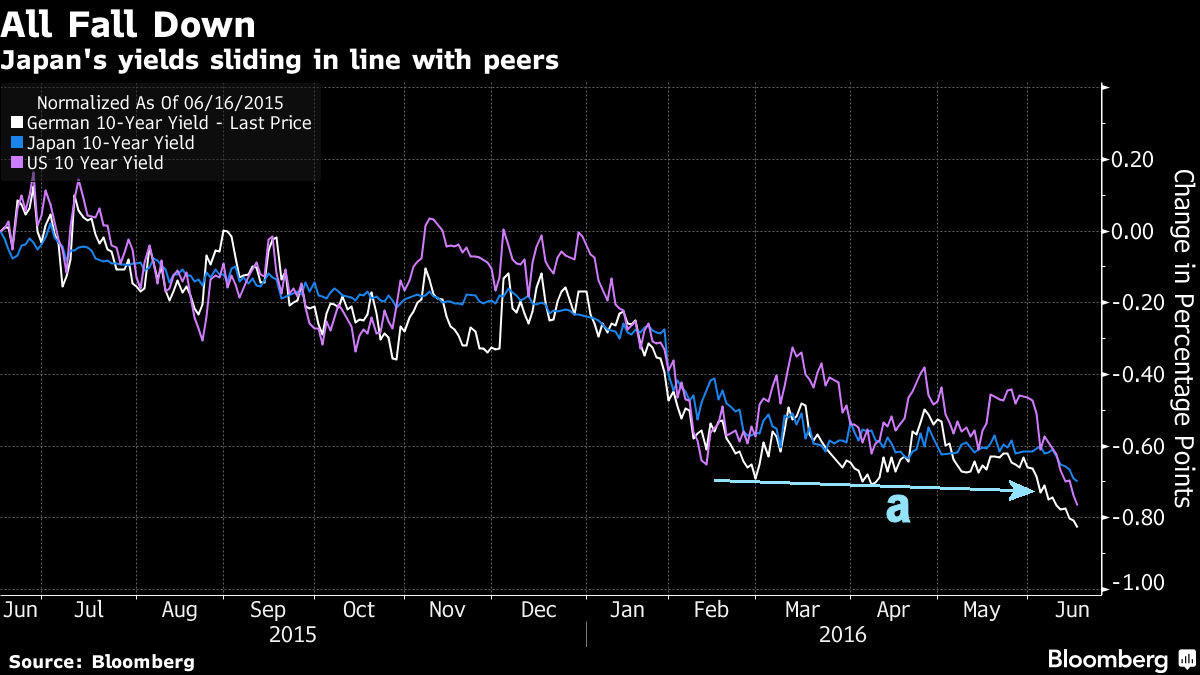
The continued decline in global bond yields got quite a bit of attention as even the yield on the 30 year Swiss bond dropped below zero late last week. The chart of the German 10 year Bunds shows that it dropped below support at line a, which completed its recent trading range. This is a sign that yields can even go lower as yields on the 10 year Japanese bonds and US 10 year notes have also dropped below their support.
The Economy
Despite the drop in stock prices and yields the economic news was generally better than expected last week. Retail Sales last Tuesday came in at 0.5% better than the consensus estimate of 0.3%. The Empire State Manufacturing Survey was again positive and it also beat expectations.
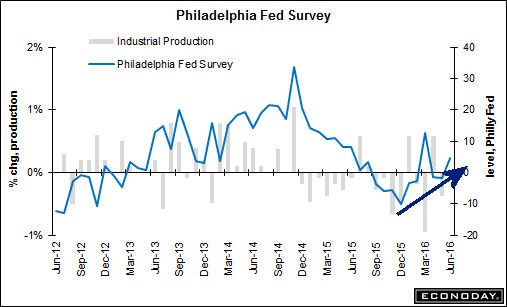
A sharp decline in vehicle production helped drop the Industrial production by 0.4% in May and it further contrasts with the better numbers from the consumer sector. The Philadelphia Fed Business Outlook Survey was much better than expected but was misleading. As Econoday commented "the constructive looking 4.7 headline doesn't match the details which are almost uniformly negative". The chart looks a bit more positive as it has formed higher lows and this makes the next few reports even more important.
The Housing Market Index rose to 60, the best reading in five months as the homebuilders are showing a high degree of optimism. Housing starts were down 0.3% in May but show a very strong gain of 9.5% on a year to year basis.
The calendar is fairly light next week with Existing Home Sales on Wednesday, followed on Thursday by the Chicago National Activity Index, PMI Flash Manufacturing Index, New Home Sales and the Leading Economic Index. On Friday we have the Durable Goods and Consumer Sentiment.
Market Wrap
Despite bouncing on Thursday stocks spend the rest of the week declining with the Dow Transports losing the most dosing down 2.2% followed by over 1% declines in the Dow Industrials and S&P 500. The weekly advance/decline numbers were solidly negative with 1164 up and 1990 down.
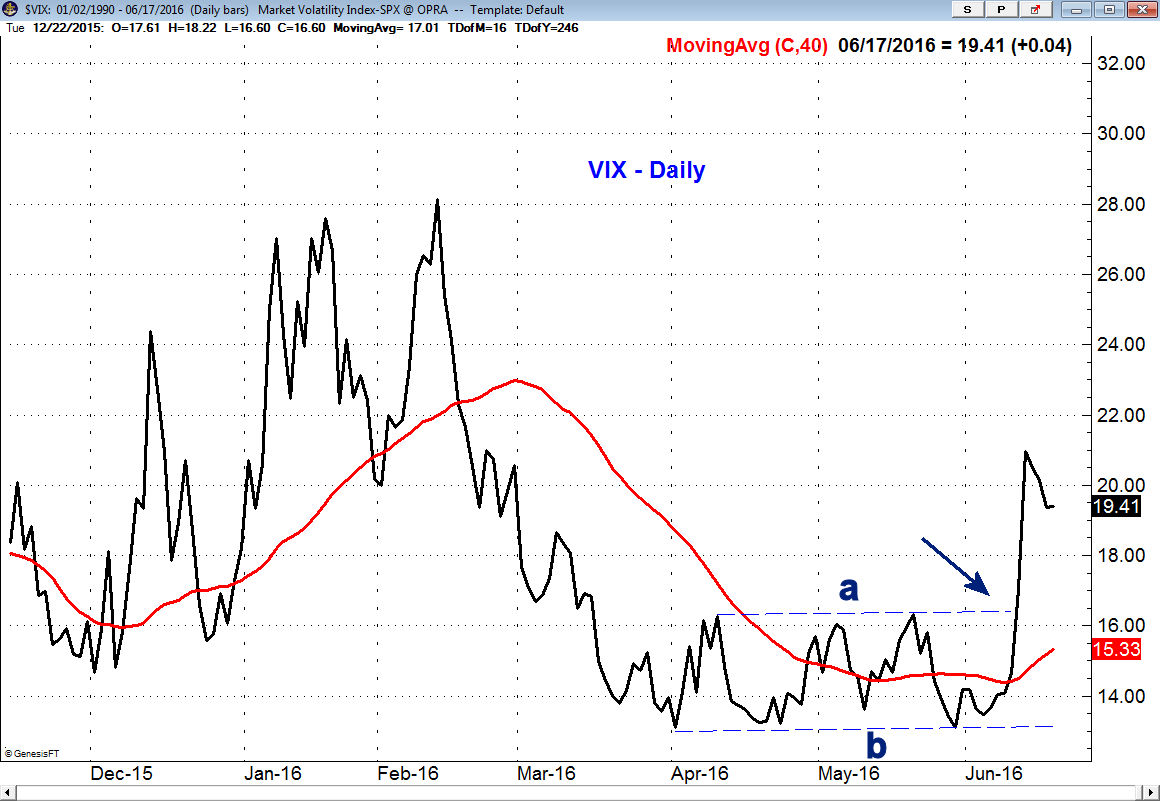
The market is clearly giving some contradictory signals as the VIX broke out of its base formation, lines a and b, last week. This is typically a bearish sign for stocks but the surge was not accompanied by a corresponding sharp decline in the market avrages. This may just be the result of a large number of traders positioning themselves for a Brexit vote against staying in the European Union.
Buying the VIX options and ETFs has been a popular but not necessarily profitable strategy for past year. I think they may be wrong again this time but it would like take a daily close below 17 to reverse the positive trend. Longer term the potential base in the VIX is something that should not be ignored.
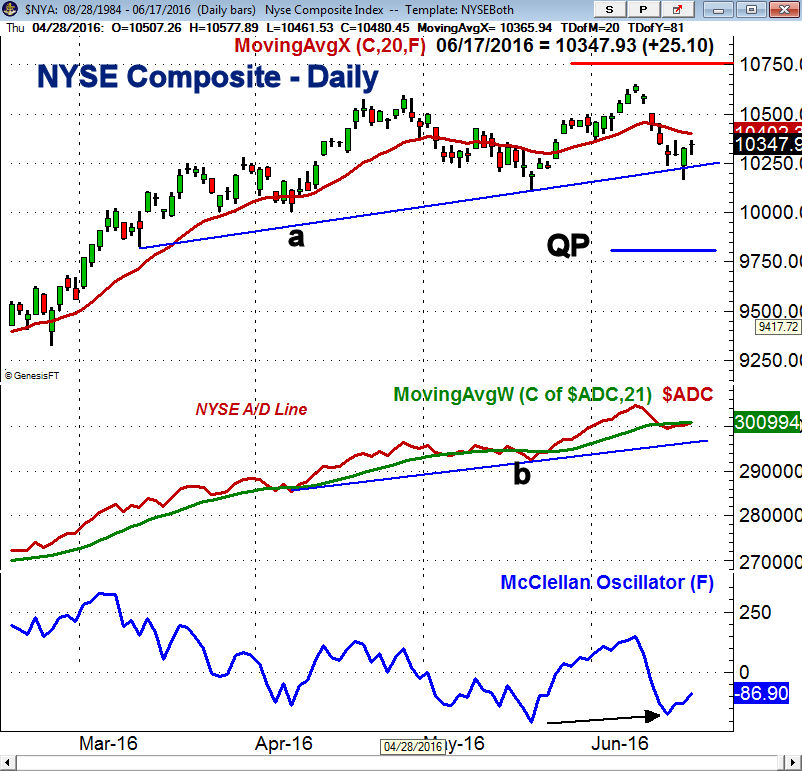
The drop early Thursday took the NYSE Composite below the support at line a, but it did not close below it. There is further support at 10,119 and then at the April low of 10,000. A weekly close below the quarterly pivot (QP) at 9808 would be a sign of a trend change.
The daily NYSE Advance/Decline line did make a new high on June 8th but stayed below its WMA for last week. It has now turned higher as the advance/decline ratios were 1.5 to 1 positive on Friday. A strong move above its WMA will be a sign that the correction is over. The McClellan oscillator is trying to turn up from the moderately oversold reading of -172 last week. A close back above the zero line would be an encouraging sign.
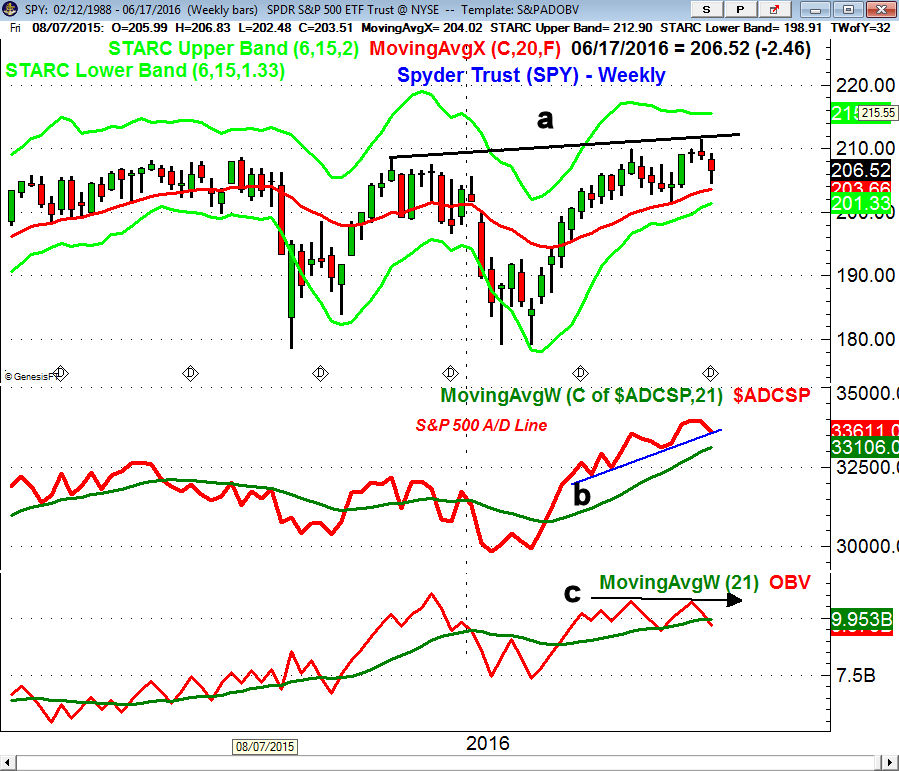
The new highs in the weekly NYSE A/D line are questioned by some who say it is a result of the sharply lower rates as there are many interest rate sensitive issues in the NYSE. That however does not explain the new highs in the S&P 500 A/D and Nasdaq 100 A/d lines they moved well above the 2015 high.
The A/D is now close to initial support (line b) but is still above its rising WMA and in a clear uptrend. Typically before a significant correction the WMA will have already flattened out as was the case in late 2015 and also last summer. The weekly OBV did not make a new high with prices and has now dropped below its WMA.
The daily S&P 500, Nasdaq 100 and Russell 2000 A/D lines all made new highs with prices on June 8th but are currently below their WMAs. It would probably take a couple of positive days before they could move back above this short-term resistance. All are still well above the more important support at the May lows.
The daily relative performance analysis has improved on the SPDR Dow Industrials (DIA) as it is now acting stronger than the iShares Russell 2000 (IWM) while the PowerShares QQQ Trust (QQQ) has lost its leadership
What to do? The market correction I was looking for a few weeks ago has lasted longer than I expected. A strong close last Wednesday could have signaled that it was over but we did not get it. The market clearly seems positioned for a No vote on June 23rd so a Yes vote may could squeeze those who are short.
I still think it would take some time and further choppy trading to reverse the positive signals from the monthly and weekly A/D lines. A weekly close in the market tracking ETFs below the quarterly pivots would be a reason to become more cautious.
There no signs on the horizon that we are on the verge of starting a new recession so even if there is a sharper correction than I am expecting I still expect stock prices to be higher by the end of the year. The previously recommended ETF buying zones for Viper ETF clients have been reached but were selected with a clear focus on the risk.
Longer term investors should continue to favor positions in low cost , broadly based ETFs or mutual funds.
I will be traveling next week and the next regular Week Ahead column will be released on July 1st.
Comments
comments