

The stock market recorded another nice week of gains as the burst of upside momentum was needed to confirm the February bottom (The Week Ahead: Is There Blood In The Streets Yet? ) as the major averages are now back to more important resistance. Some may forget that just three weeks ago the S&P 500 hit 1810 and it has now moved above the 2000 level .
Most have not forgotten the angst of the January drop in their stock portfolios and while those that held on have now recouped some of their losses those who sold during the decline are now facing a tough decision. I was not expecting the extent of the stock market drop at the start of the year but the technical readings and very negative sentiment by January 15h convinced me that selling into the decline was not the best strategy.
A week after the January lows I was looking "for a rally to the $198-$200 area". I had concluded that " the recent drop does not seem like the first phase of a new bear market" and that stabilization ion crude oil should help fuel a significant rebound. It is important for investors to remember that after the 21.6% correction in 2011 the S&P 500 took six months before it again made new highs. Patience is still a key trait of successful investors.
Ever since the NK225 topped in 1989 I have urged investors to regularly follow the major overseas stock markets even if they are only investing in the US stock market. For more active investors the country specific ETFs that I monitor for the Viper ETF clients often offer some good profit opportunities. Several of these ETFs have now given intermediate term buy signals and I will be looking to recommend them on the next correction.
In today's column I will look at the technical outlook for three of the key global stock markets. Since the June 2012 low the Dax Index has typically been stronger than the S&P 500 on the rallies and has often topped out before the S&P. From the October 2014 low the Dax Index gained 48% before topping out in April 2015. The S&P 500 rose just 17.2% from the October 2014 low and peaked in May, a month after the Dax .
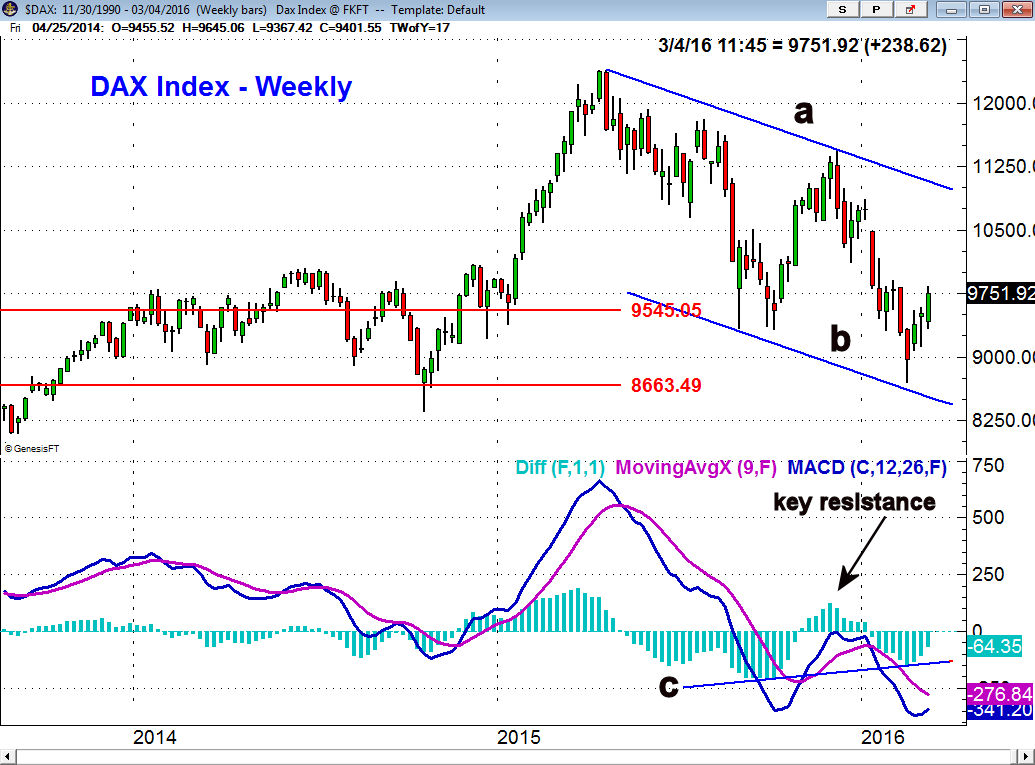
From the April 2015 high to the February lows the Dax has dropped 29.8% as the decline has been much worse than that of the S&P 500. Never the less the Dax appears to be holding above the major 50% retracement support from the 2011 lows at 8663. The weekly chart shows a well defined trading channel, lines a and b, as the lower boundary was almost reached on the last drop.
The weekly MACD-His has formed a potential bullish divergence as it has formed higher lows, line c, while the Dax has formed lower lows. In order to confirm the divergence and to signal an important low the MACD-His needs to move above the late 2015 high (key resistance on chart). The Dax has major resistance now in the 10,500-11,000 area.
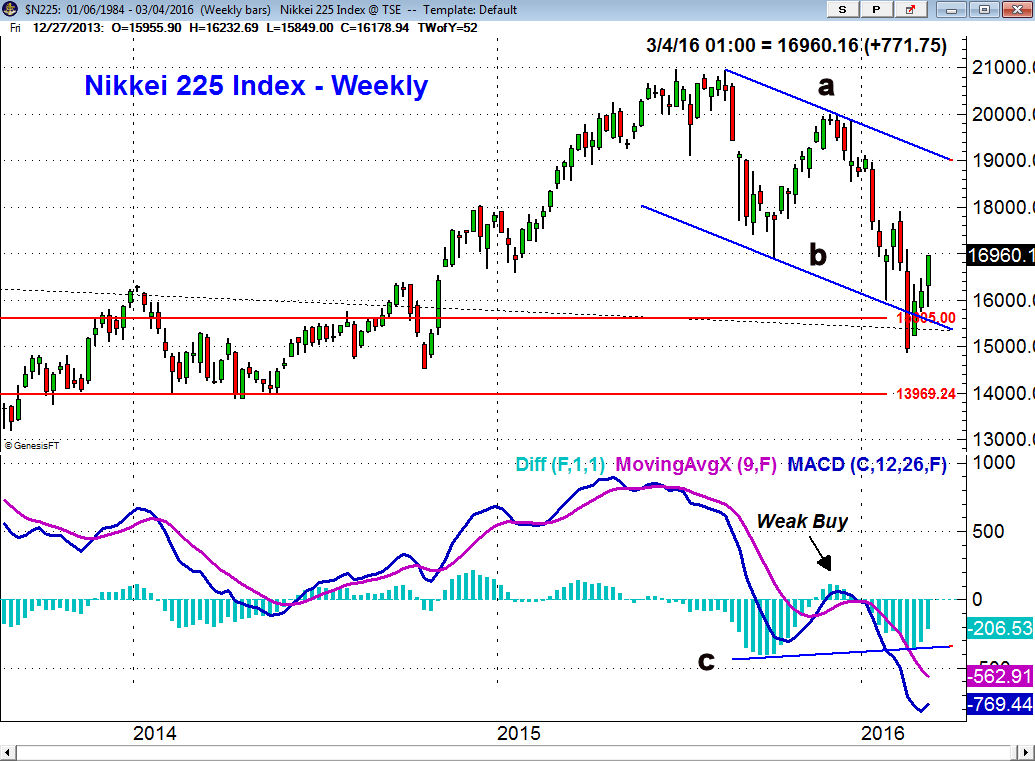
Since Japan's Nikkei 225 peaked in 1989 their economy and stock markets have been a good example of how hard it is to overcome deflationary pressures. The weekly chart shows that the NK225 broke out in 2014 and rallied up to the 21,000 level last August before it topped out.
The 38.2% support from the 2009 low at 15,605 has been reached with the more important 50% support at 13,969. Unlike the Dax the NK225 dropped below the lower boundary of the trading channel, line b, in early February. The next key resistance is at 18,000 with the downtrend, line a, in the 19,200 area.
The MACD-His buy signal in late 2015 was not impressive as it just barely moved into positive territory before reversing to the downside. The MACD-His did not make new lows, line c, as the NK225 was making its low. The MACD and signal lines are acting much weaker as they have made sharply lower lows. Therefore the potential bottom in the NK225 is not as strong as that of the Dax.
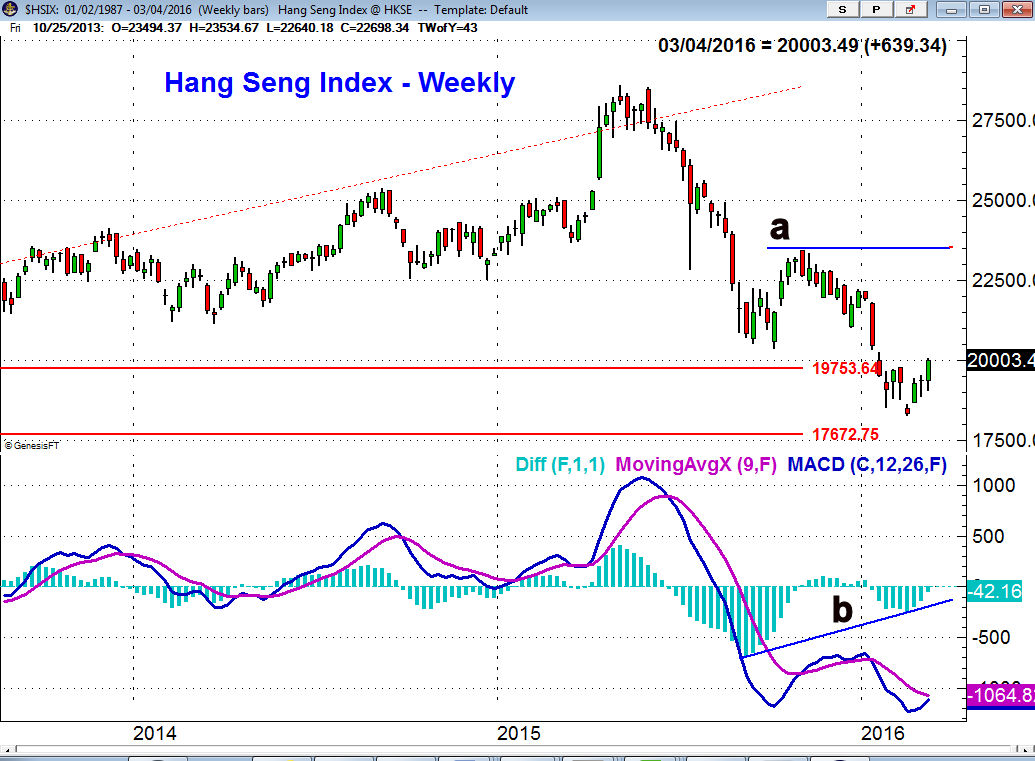
The Hong Kong Hang Seng Index peaked at the end of May and though it formed a bottom in October the rally was weak. The Hang Seng just made it back to the 38.2% Fibonacci resistance before the decline resumed. There is first resistance now in the 20,300 area which was the October low. There is more important resistance at 23,350 ( line a) that needs to be overcome to confirm a new uptrend.
Just as was the case with the other global indices, the MACD-His on the Hang Seng has formed higher lows, line b. It is close now to moving into positive territory but must overcome the highs from late 2015 to confirm that a weekly bottom is in place.
These key global markets in my opinion are not sending any warnings of an imminent crash but of course they will need to be monitored if they rally back to resistance. As I discussed last week " The Week Ahead: Should Investors Ignore "The Wall of Worry"? I feel the investor fears over the Chinese economy are overblown. The ECB is likely to take more steps at their next meeting to stimulate the Euro zone economies and the analysis of their stock markets does look constructive.
The Economy
The strong jobs report last Friday and the evidence that new job seekers are entering the markets is a sign that the confidence in the economy is strong. This is in contrast to the headlines proclaiming an ongoing or imminent recession.
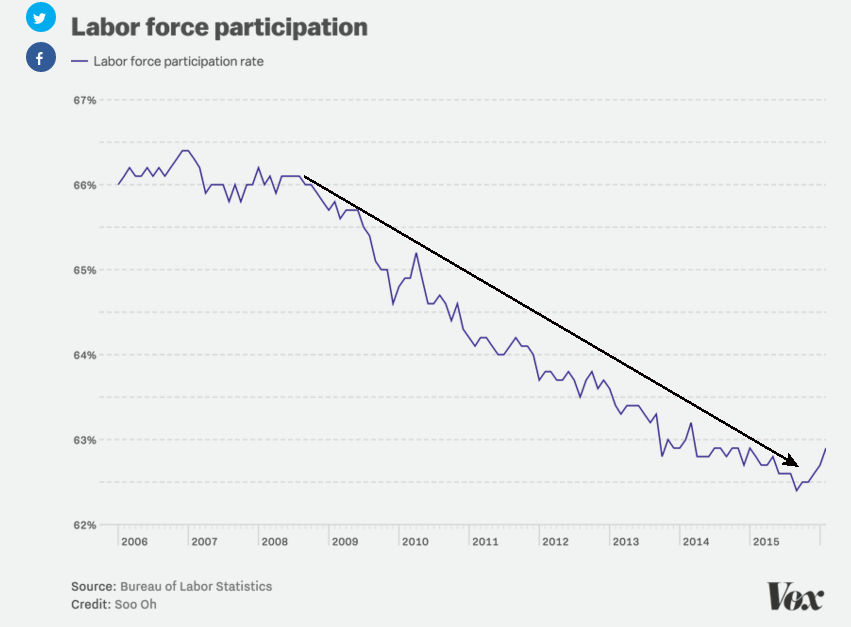
The evidence of new workers coming into the market is based on the labor participation rate that has finally started to increase. The steep downtrend, line a, may now have been broken. However the rate has been declining since 2008 as it hit a 39 year low in October. A monthly reading above 63.2 would be a more convincing sign that this trend has changed. This combined with the hints of increasing inflation mentioned last time is an overall positive for the economy.
Last week started off with more disappointing news as the Chicago Purchasing Managers Index (PMI) dropped to 47.6 after the strong reading of 55.6 in January. This survey covers both the manufacturing and non-manufacturing companies. It still was better than the continually weak Dallas Manufacturing Survey as it only improved slightly last week to -8.5. The Dallas and Kansas City regions have borne the brunt of lower crude oil prices.

The PMI Manufacturing Index came in as expected on Tuesday at 51.3 but the ISM Manufacturing Index rose to 49.5 which was higher than the past three months. This may have broken the downtrend, line s, but it is too early to be confident.
The data last Thursday on the services sector was pretty much as expected as PMI Services Index came in a 49.7 which was about the same as the flash reading but down from 53.2 in January. The ISM Non-Manufacturing Index at 53.4 was just above the consensus estimate of 53.1. It is still holding well above the key 50 level.
Factory orders were up 1.6% which was stronger than expected but it was consistent with the recent sharp increase in Durable Goods. Though this is encouraging so far the early data on manufacturing has not been impressive.
Interest Rates and Commodities

The yield on the 10 Year T-Note has risen sharply since it closed on February 19th at 1.748% and came very close to the long term support from 2013 in the 1.691% area (line b). The yield looks ready to close the week at 1.897%. The 20 week EMA is now at 2.010% which represents strong resistance. The long term downtrends is still much higher at 2.50%.

Crude oil has had another good week as it has now reached the downtrend on the weekly chart, line a. The former support from 2015, now resistance, is in the $37.80 area, line b. The sluggish nature of the recent rally has not been accompanied by any strong volume as the OBV has just now moved above its WMA. The HPI has moved above its downtrend, line c, but is still below the zero line where the rally failed last October.
The pullback in gold and the gold miners from the recent highs has been very shallow and it did not present any good risk/reward opportunities. Both GLD and GDX have held well above their first support levels which meant that very wide stops needed to be used on new long positions.
Market Wrap
The third week of solid gains has clearly started a shift in the prevailing bearish sentiment. Less than two weeks ago trader sentiment was decidedly bearish (Don't Follow Those Bearish Traders) as the focus was on selling the rally. Now the discussion seems to be on what sectors investors should buy..
The small cap Russell 2000 led the way gaining 4.3% followed by a 3.6% gain in the NYSE Composite and another solid 3.3% rise in the Dow Transports. More importantly the market internals were again strong on a weekly basis with 2723 issues advancing and just 461 declining.
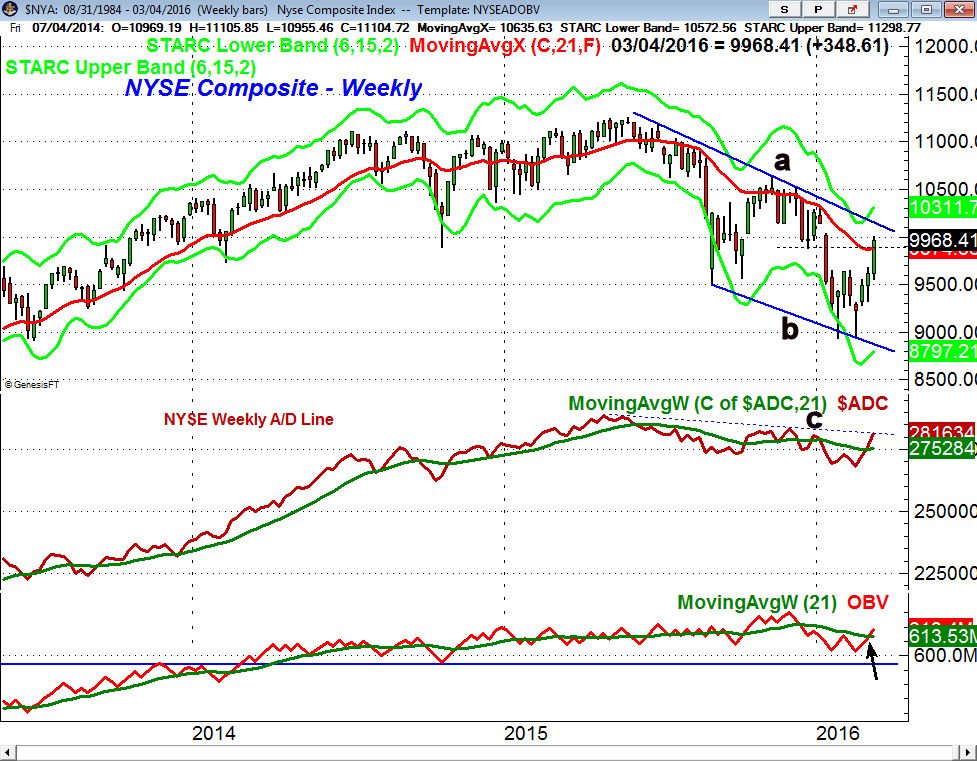
The NYSE Composite closed well above the 20 week EMA as our initial upside target was reached. The downtrend, line a, is now at 10,100 with the weekly starc+ band at 10,311. There is more formidable resistance in the 10,400-10,650 area.
The weekly NYSE A/D line has improved even further after overcoming its WMA last week. The major downtrend, line c, is now being tested and a move above the November highs would confirm a new uptrend. It is encouraging that the WMA of the A/D line is now trying to turn higher. The weekly OBV is also now back above its WMA. The 20 day EMA is at 9615 with the monthly pivot at 9395.

The Spyder Trust (SPY) overcame the 61.8% Fibonacci resistance at $199.18 as it closed above the $200 level and the monthly R2 pivot resistance. The daily starc+ band is at $203.18 with the weekly starc+ band and the trend line resistance is in the $206.50 to $207.42 area.
The daily resistance from the November- December highs (line b) in the S&P 500 A/D line was overcome last week. As I noted two weeks ago it has started to accelerate to the upside. It is still acting strong but is now well above its rising WMA. The bullish divergence in the A/D line at the February lows (line c) helped identify the market bottom. The OBV is above its WMA but still lagging.
The SPY is over 3% above the 20 day EMA at $194.38 with the daily starc- band at $193.94. The current 50% retracement support is at $191.54 with the monthly pivot is at $190.44.
The iShares Russell 2000 (IWM) tested its daily starc+ band on Friday and is also looking a bit overextended after the recent strong rally. The PowerShares QQQ Trust (QQQ) did not make much upside progress late in the week and formed a doji on Friday. Its 20 day EMA and has first support is at $103.10.
What to do? The very strong jobs report and powerful stock market gains last week have clearly gotten the market's attention. The major averages have reached the upside targets that I outlined at the February lows and some of the daily starc+ bands were reached at the end of the week. The stock market gains last week were supported by strong A/D ratios which was needed to signal that the rally had gained strength.
Several of the ETFs that I have recommended to Viper ETF clients have reached near term targets where traders have taken short term profits. As the market has become more overextended we have become less aggressive buyers and are now looking for a pullback so that investors or traders can add to their long positions.
The fact that the weekly A/D lines have now overcome their major downtrends supports my favored scenario that the January drop was a bull market correction not the start of a new bear market. We will get a clearer picture in the next few weeks and on the first pullback will tell us more.
I think it is important to realize that even if an major low was completed at the February there was significant damage done by the market's decline. It will take time for the market to heal and makes it increasingly likely that we will see a 1-2 week correction in the next month or so.
For investors who panicked and sold during the decline this weekly setback should be the best opportunity to get back into the market. For those who decided to reduce their stock exposure on the rally I recommend that you do not react hastily to last week's action . Take the time to reconsider what level of stock market exposure will allow you to weather the inevitable steep market corrections in the future.
In reviewing my weekly scan of the stocks in the Nasdaq 100 and those in the Investor's Business Daily Top 50 over twenty stocks have generated new weekly buy signals. For Viper Hot Stocks clients these stocks will be reviewed over the weekend to find new buy candidates before Monday's open.
Comments
comments