

Now that the S&P 500 has closed barely above 2100 and the Dow Industrials have moved back above 18,000 a few more of those on air analysts have moved to the bullish camp but many still have not. Some were waiting for a move in the S&P 500 above 2070 before they discarded their bearish stance.
Once again the market internals that is the A/D ratios have been strong with the A/D lines on the NYSE Composite and S&P 500 now well above the bull market highs from May 2015. When a majority of high profile traders were uniformly bearish on February 23rd (Don't Follow Those Bearish Traders) it was the A/D line analysis that provided a clear reason why you should not join those traders on the short side.
Of course, the market needs bearish traders, recession forecasts and periodic bubble warnings in order to move even higher. Many of the investor fears on the "The Wall of Worry" from late February have now moved to the back burner but they are likely to crop up again in the weeks ahead.
Though the bearish arguments have subsided in the past month recently the argument was made, based on P/E analysis, that the market was now similar to 2008. In today's column I would like to show why the market is much different technically now than it was in 2008.
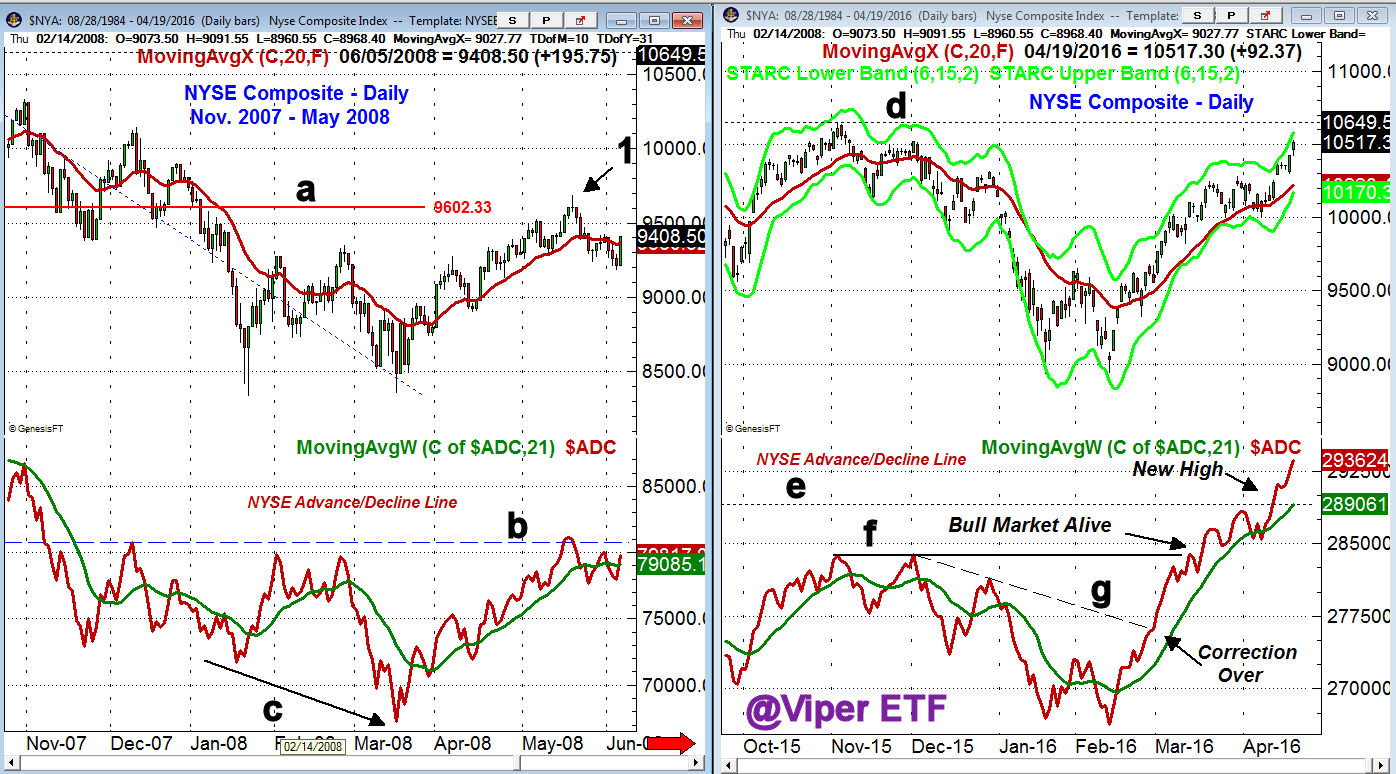
The NYSE Composite peaked on October 11, 2007 at 10,387 and on March 17th 2008 had dropped to 8362. This was a decline of 19.4%.
- By May 18th the NYSE Composite rallied intra-day to a high of 9687 but closed at 9602 right on the 61.8% Fibonacci retracement resistance that was calculated from the October 2007 high.
- The NYSE had formed a daily doji and the following day closed below the doji low triggering a short term sell signal.
- Just four days later the prior swing low was violated confirming a new downtrend and by early June the March lows had been violated.
- The NYSE A/D line had formed a series of negative divergences before the October 2007 high (One Indicator Stock Traders Must Follow)
- The NYSE A/D line made sharply lower lows in March than in January (line c) which was a sign of weakness.
- The NYSE A/D line was only able to move slightly above first strong resistance, line b, in May before it topped out.
- By late June the A/D line had dropped to new lows.
The NYSE Composite made marginal new lows on February 11th at 8944 as it was down 20.5% from the May 2015 high.
- Though the NYSE A/D line did make a marginal new low with prices, the S&P 500 A/D line did not.
- As I noted at the time the NYSE High/Low and McClellan oscillator both formed bullish divergences at the lows.
- The NYSE A/D line overcame its downtrend, line g, on February 26th confirming that the correction was over.
- The A/D line then surpassed the November-December resistance, line f, in March confirming that the bull market was still alive.
- A week ago the NYSE A/D line moved above the May 2015 highs, line e.
- The next strong resistance for the NYSE is at 10,641 and the November 2015 high, line d.
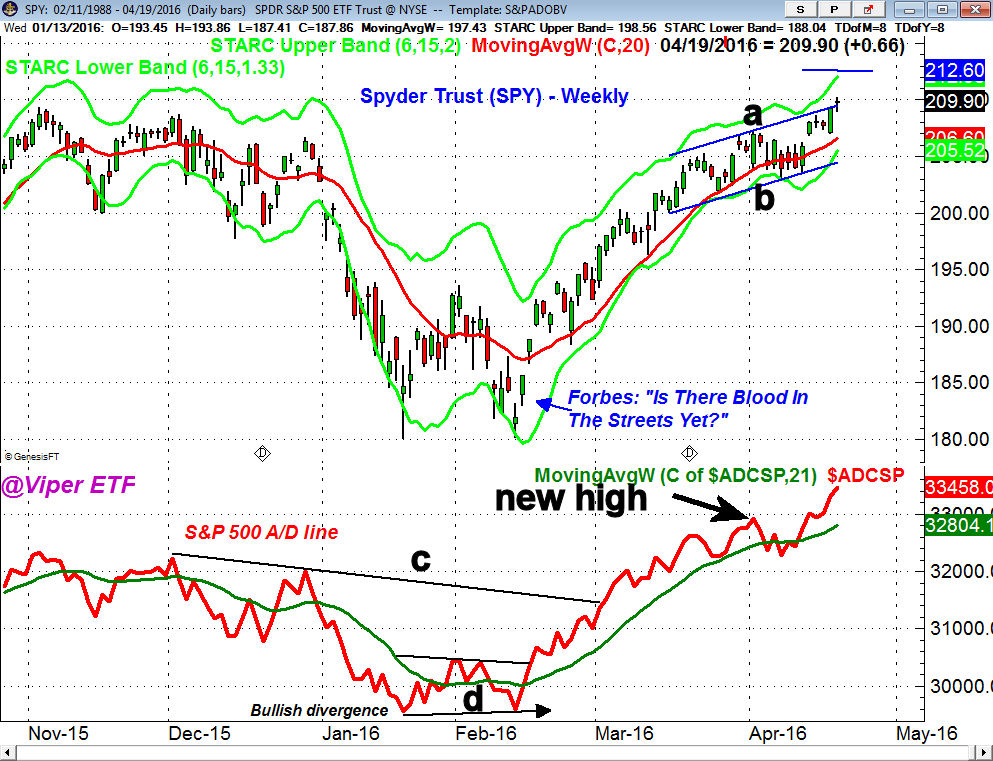
The Spyder Trust (SPY) is now up 3.5% YTD as it has closed above the upper boundary of the trading channel, line a.
- The daily starc+ band is just above $212 with the monthly pivot resistance at $212.60. The weekly starc+ band is at $218.69.
- The rising 20 day EMA is now at $207 with stronger support in the $204-$205.50 area.
- The S&P 500 A/D line formed a bullish divergence at the February lows, line d.
- The bottom was then confirmed on February 16th as the resistance at line c was overcome.
- The move in the S&P 500 A/D line above the downtrend, line c, in early March was another bullish sign.
- The A/D line was finally able to exceed the May 2015 high on April 1st (see Tweet).
- The A/D line has turned sharply higher this week and while that does not rule out a pullback it would take some time before it could top out.
So what's next? It has been my view since before the earnings season that the results would be better than the dire pre-earnings forecasts. The initial data suggests this may be correct but the next couple of weeks will be important. There are several ETFs, including SPDR S&P Oil & Gas (XOP) , that were recently added to the Viper ETF portfolio with several others that now look interesting.
Investors should be aware that despite the bullish technical outlook a 5-10% correction is likely in the next few months. Therefore as I discussed last weekend " The Week Ahead: Risk-Can Your Portfolio Handle It?" now is a good time to take a critical look at your portfolio to determine whether your exposure to the stock market is appropriate.
Comments
comments