

The initial reaction to the weak jobs report Friday caused further selling in early trading Friday. Investors apparently were more concerned about the weakness in the economy than the prospects that the Fed will not raise rates soon. Based on the Fed fund futures the odds for a hike in June are at 13%, 30% in July and only 42% in September.
The trading for the first week of May has caused a further drop in bullish sentiment as according to AAII only 22.3% are now bullish which is down 5% from the previous week. This is the lowest reading since the 19.24% reading from February 12 which was one day after the market's low. This low bullish reading then corresponded with the key technical readings (Is There Blood In The Streets Yet?) that indicated the stock market was finally bottoming.
Investors should also remember that the January 15th 2016 reading of 17.9% was the lowest since 2005 and was much lower than any reading during the 2008 bear market. This sentiment data is best used as a contrary indicator which means that a high level of bullishness is a potentially negative for the stock market while a low reading can be positive if it lines up with the technical readings.
Typically the bullish% has been quite high at past major market tops and the average bullish reading of individual investors from November 1999 through April 2000 was over 52%. This included a peak reading of 75% in early 2000 as the Nasdaq Composite was making its high.
At the bull market high in October 2007 the bullish% peaked at 54.6%. Since the start of the current bull market in 2009 the highest reading has been 63.3% in December 2010. The highest reading in 2015 was 51.7% but it only barely made it above 40% late in the year. Though the current reading does not mean the market cannot decline it is not consistent with a major top as many of the weak longs have already been sold.
The bearish sentiment is still quite low at 30.3% as it was much higher at 48.7% at the January and February lows. The high 47.3% neutral reading would need to typically drop before the reading would be consistent with a correction low.
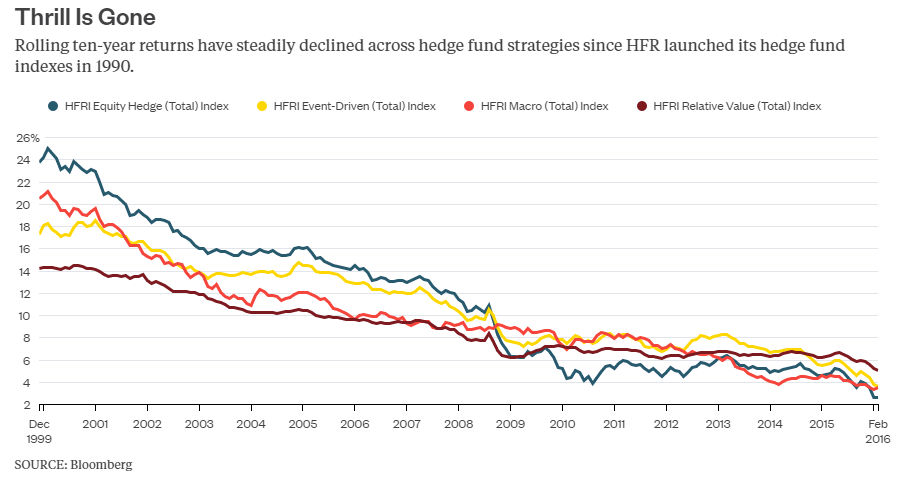
The financial press was focused last week on the Sohn Conference which raises money for pediatric cancer. At the conference many of the best-known hedge fund managers share their investment ideas to conference attendees and the often conduct extensive interviews. The long-term chart of the performance for various hedge fund strategies from Bloomberg shows that "all of them have weathered the same steady decline in rolling ten-year returns since 1999."
It was my view in July 2014 "The Week Ahead: One Bubble Starting to Burst?" that the hedge fund bubble was bursting. I had wondered the previous month why many high net worth investors were still putting money in hedge funds with their high fees and dismal performance. The largest US pension fund CalPERS had announced in July 2014 that would stop investing in hedge funds and this was when the bubble started to burst.
It has been a rough few years for hedge funds as in 2015 as two of the best known hedge fund managers lost over 20%. Just last week American International Group (AIG) reported a quarterly loss of $183 million which was due in part to a $537 million drop in their hedge fund holdings. MetLife (MET) also reported a 19% drop in earnings as their hedge fund holdings also performed very poorly.
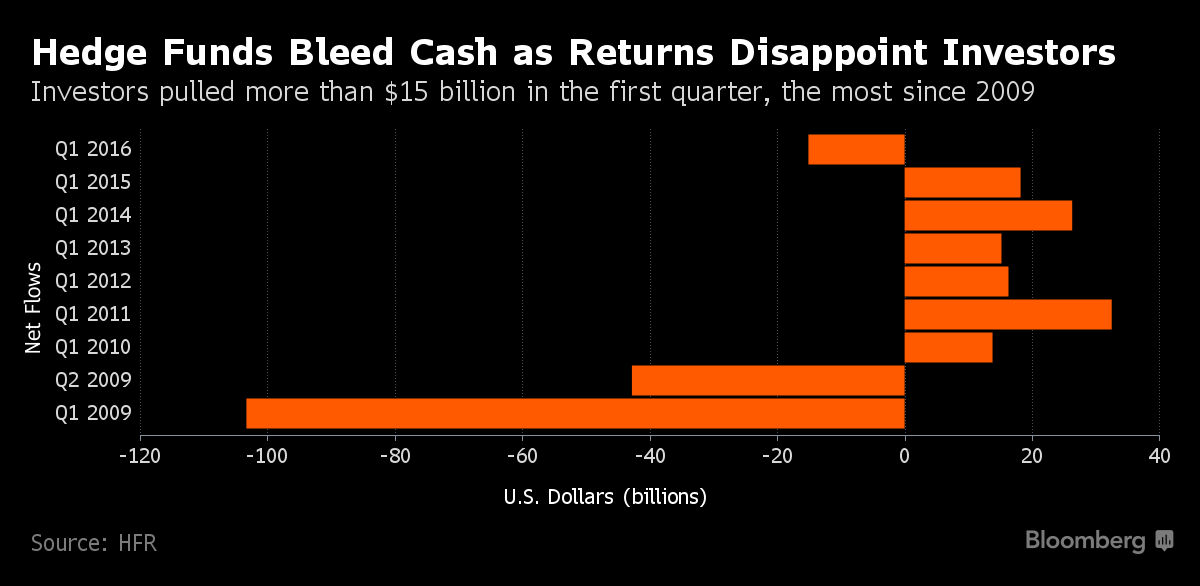
It should therefore not be a surprise that investors pulled $15 billion out of hedge funds in the first quarter which was biggest outflows since the first two quarters of 2009. If First Capital's hedge fund manager Dan Loeb is right this may just be the start as he called the 1st quarter as "one one of the most catastrophic periods of hedge fund performance ". Furthermore Third Point also said ""There is no doubt that we are in the first innings of a washout in hedge funds and certain strategies".
Though some look to the hedge fund managers for stock ideas Bloomberg's Hedge fund VIP Index stock (GSTHHVIP) has not done well as their most widely held stocks have seriously underperformed the Spyder Trust (SPY).
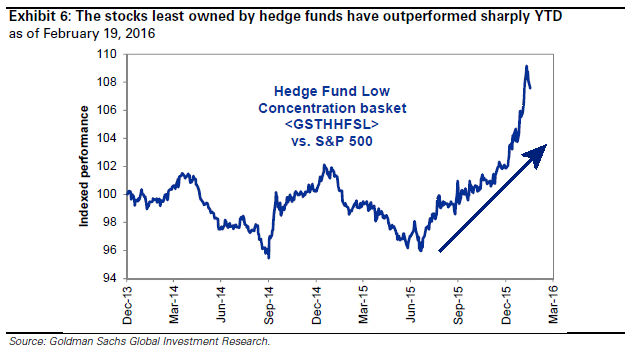
Though some of these stocks are in the scan list for the Viper Hot Stocks I have not recommended any of them. The chart of the corresponding index of those stocks that are not widely held by hedge funds (GSTHHFSL) has significantly outperformed the S&P 500 as the index has skyrocketed since the July 2015 lows.
Many of the hedge fund managers have macro views which I have always had a problem with they typically do not use technical analysis so they do not have a clear exit point when the position goes against them. Several again expressed their negative outlook for both the US economy and stock market. One hedge fund manager, Richard Deitz from VR Capital Group does see opportunities in Europe and likes Greek debt.
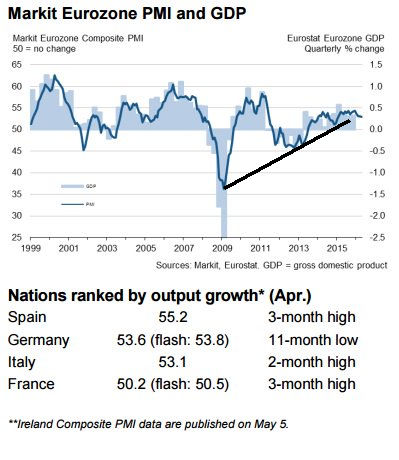
Eurostat recently surprised the markets as they reported a 0.6% increase in the growth of the 19 bloc Euro union. However the economic data for Europe is mixed as the Markit Eurozone PMI has dropped back its uptrend, line a. The data shows strong improvement for Spain, Italy and France but the PMI has been deteriorating for Germany. One wonders how long the other Euro zone economies can continue to improve if Germany stays weak. This makes the Euro zone data over the next few months even more important.
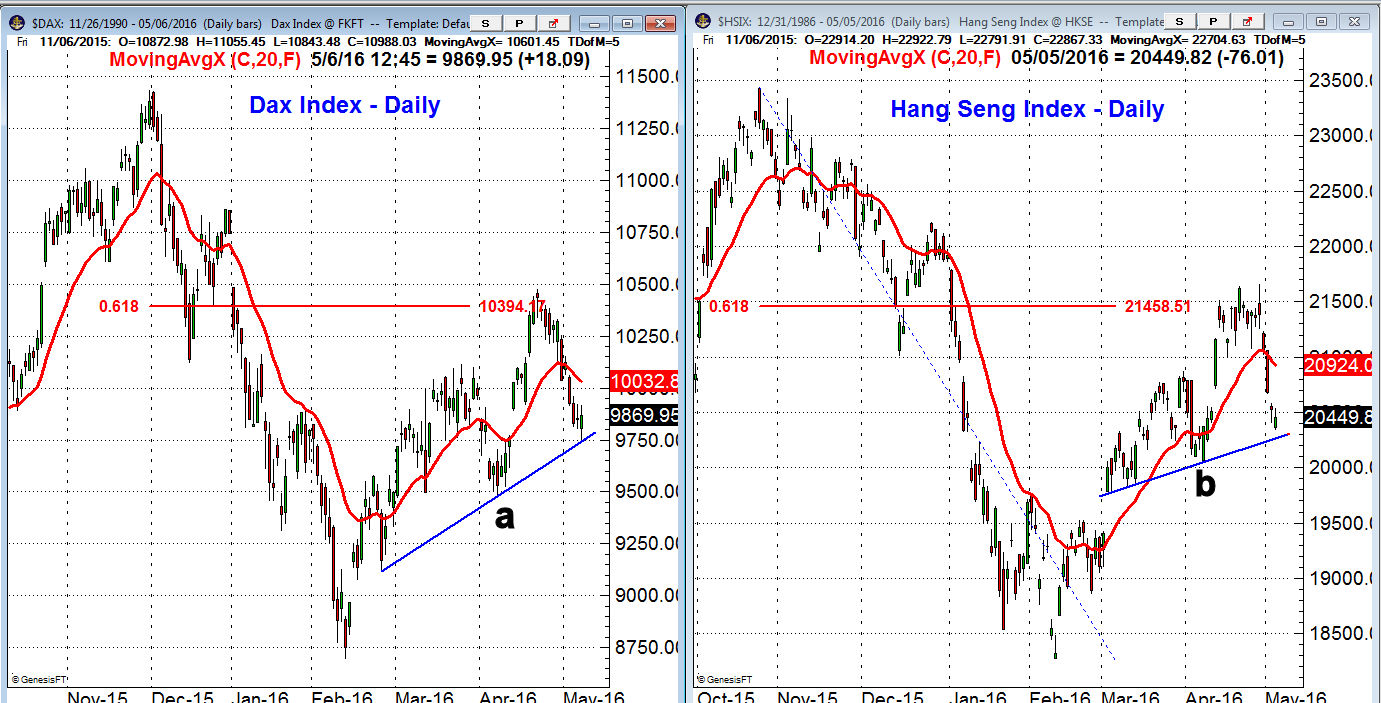
Since early March I have been concerned about the failure of some overseas markets to keep pace with the US stock market. The German Dax Index was only able to close above the 61.8% Fibonacci retracement resistance from the December 2015 high for two days in April before it turned lower. The uptrend, line a, is now being tested with next good support in the 9500 area. This is 3.7% below Friday's close.
The Nikkei 225 was also not able to stay above its 61.8% resistance level before dropping sharply back to chart support at line b. A weekly close back below the 20,000 level would be quite negative technically and should also cause a large increase in bearish sentiment.
The Economy
The manufacturing data on Monday was pretty much as expected with the ISM Manufacturing Index at 50.8 with the consensus estimate at 51.5. It was a similar result from the PMI Manufacturing Index and Construction Spending held firm. Also last week Factory Orders showed a solid 1.1% gain in March but the February report was revised down 1.9%.
The PMI Services Index came in at 52.8 and though it was not impressive it was the best reading since January. The recent improvement in the service sector is evident on the chart of the ISM Non-Manufacturing Index as it has had solid gains in the past two months. The reading at 55.7 is still well above the 50 level.
The economic calendar this week is relatively light with Import and Export Prices on Thursday along with the jobless claims. On Friday we have Retail Sales, Producer Price Index, Business Inventories and the mid-month reading on Consumer Sentiment.
Interest Rates & Commodities
It was a wild week for interest rates as they fell for most of the week but then after an early decline rallied to close higher on Friday. Trading ranges are intact across multiple time frames with short-term support now at 1.685% and resistance at 1.941%.
Crude oil closed the week lower as it was down $1.26 but managed to close $1.40 above the week's lows. The weekly studies are still positive and volume increased late in the week as prices rallied.
Gold also rallied on Friday and based on the technical studies it looks as though the pullback is over. The correction in gold futures was fairly shallow as it just dropped 2.4% from highs while the Market Vectors Gold Miners (GDX) had over a 10% correction. One concern for me is that the hedge funds have their largest long positions in gold since 2011.
Market Wrap
The Dow Transports and Russell 2000 were hit the hardest last week as they were down 1.7% and 1.4% respectively. The Dow Industrials were down only 0.2% while the Dow Utilities gained over 0.7%. There were 1759 stocks declining while 1413 advanced.
Consumer goods and services were the only positive sectors as both posted slight gains. Oil and gas were hit the hardest as they were down 3.4% while the material sector lost 2.4%. The health care stocks were down over 1% and the industrials lost 0.6%.
Last weekend I thought that the correction might be over by mid-week so it has lasted longer than I expected. The late day reversal Friday is likely the start of a short-term rally as the SPDR Dow Industrials (DAI) did generate a doji buy signal on the close.
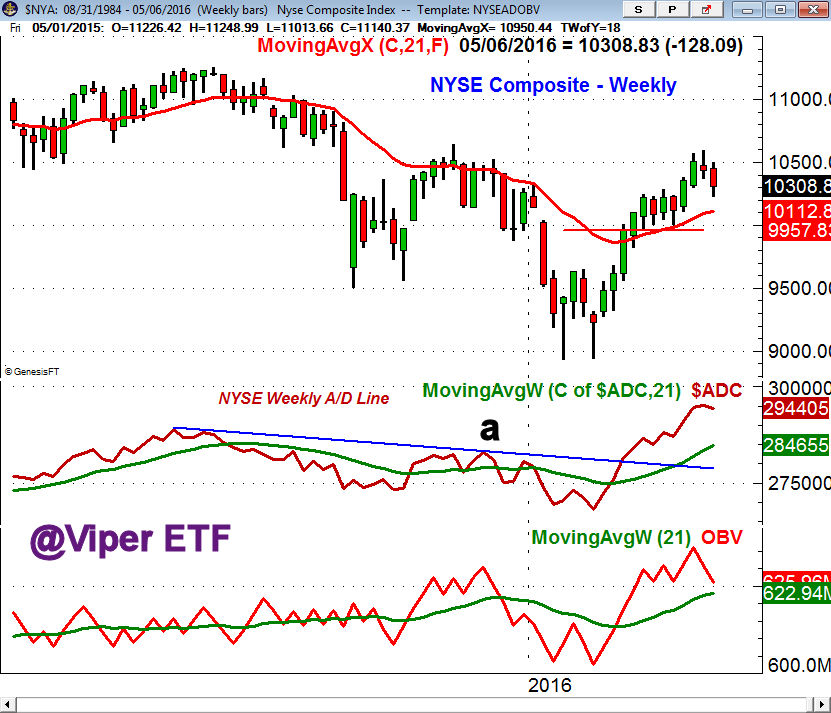
The weekly chart of the NYSE Composite suggests that this is just a normal pullback with the 20-week EMA at 10,112. The 38.2% Fibonacci retracement support from the January lows is at 9557 which is 3.4% below Friday's close. A strong weekly close above last week's high would indicate the pullback is over. This would be consistent with the low level of bullishness and the overall skepticism about the stock market's rally.
The weekly Advance/Decline line has turned down slightly but is still well above its rising WMA. The break of resistance, line a, in the A/D line was a bullish sign early in the rally. The weekly OBV has dropped further but is still above support at its rising WMA.
The daily A/D line (not shown) turned up Friday and is now back above its WMA which is an encouraging sign. The McClellan oscillator rose to -89 after holding above the early April lows at -136.
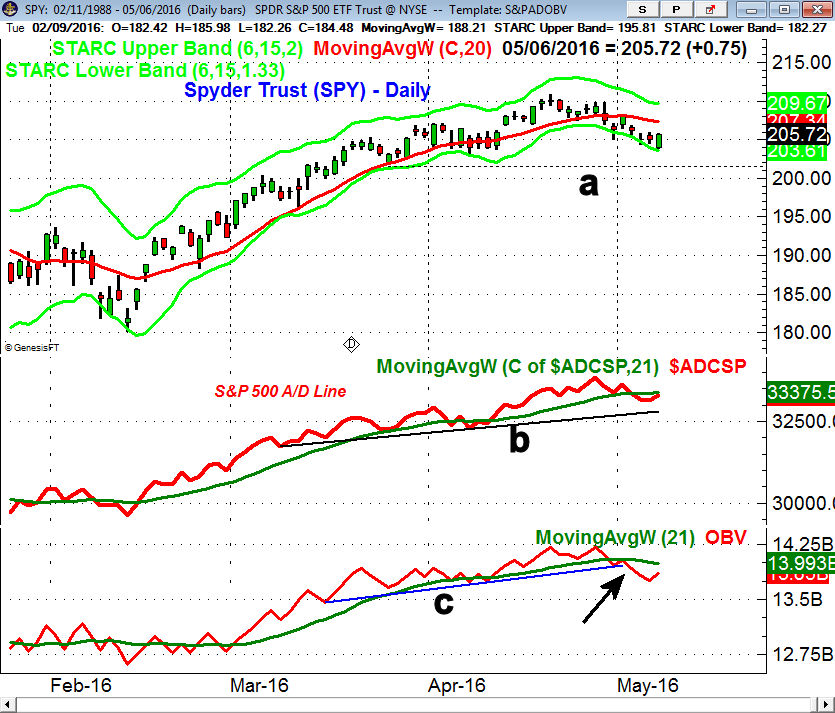
The Spyder Trust (SPY) needed to close above Thursday's doji high at $205.85 to generate positive short-term momentum but it fell just short. The 20 day EMA is at $207.34 and a close back above this level would be positive. A daily close above $209.81 would be a sign that SPY is going to challenge the April 20th high. The decline last week came close to the daily starc- band which is now at $203.82. There is stronger support at $201.74, line a.
The S&P 500 A/D line has turned up but is still barely below its WMA. It has held so far well above the more important support at line c. The OBV has been much weaker as it dropped below its support , line c, and is now well below its declining WMA.
The technical studies on the Powershares QQQ Trust (QQQ) still look the weakest as the Nasdaq 100 A/D line (not shown) has dropped below the late March and early April lows. The daily A/D line has turned up but it would take a couple of days on the upside just to reach its declining WMA. The weekly A/D line is still above its WMA and more important support.
The iShares Russell 2000 (IWM) tested daily support on Friday before closing higher. There is stronger resistance at $111.68. The Russell 2000 A/D has turned up from support which is consistent with a pullback in an uptrend.
What to do? The deterioration in the Nasdaq A/D line last week warned of last week's market decline. This makes the action this week now more important. The positive weekly technical readings and low bullish sentiment still suggest that this was just a correction not a significant top.
A further rally this week will need to be watched closely especially the A/D numbers. Two consecutive strong closes with A/D ratios that are better than 2-1 positive will suggest that the uptrend has resumed. If on the other hand the S&P 500 rally stalls at first resistance in the 2075-2083 area and the A/D ratios are weak it will be a sign of weakness.
A lower close this week will indicate that the market correction is going to take prices back to the more important S&P 500 support in the 2000-2015 area. That would not be enough to alter the positive intermediate term trend but it will mean that the next rally is more important.
Comments
comments