Stocks held up well on Monday and while the Spyder Trust (SPY) was up only slightly the A/D ratios on the NYSE were 2-1 positive. The S&P 500 A/D ratios were also strong and both A/D lines have continued to make new highs as they have surpassed the late December peaks.
The fact that the A/D line was leading prices higher was instrumental in identifying the February lows (The Week Ahead: Is There Blood In The Streets Yet?). The Spyder Trust (SPY has surpassed the 61.8% Fibonacci resistance from the early November highs and the NYSE overcame its retracement resistance on Monday.
There are were signs late last week that the market was forming a short term top but the overnight selling Tuesday was initially well absorbed. Just after the open Tuesday the sellers took over and a close in the S&P futures below $197.40 should confirm that a correction is underway.
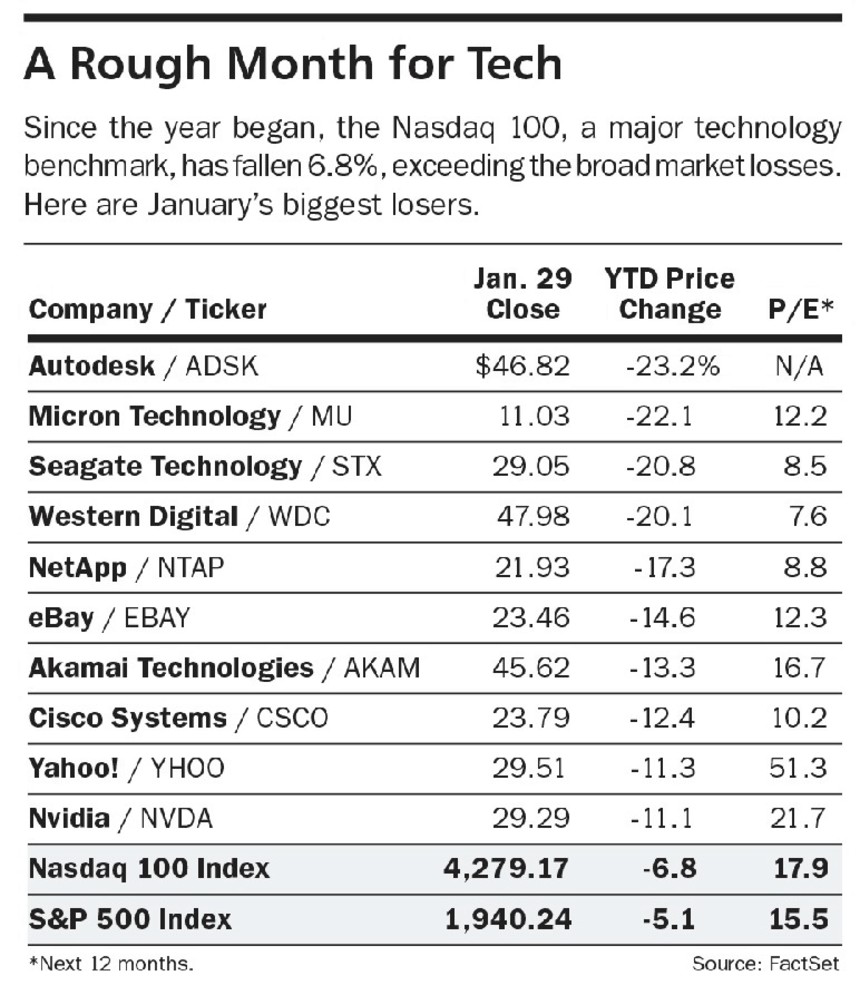
In a Barron's January 30th column "5 Battered Tech Stocks to Buy Now" they featured the above table and highlighted five stocks Autodesk, Akamai, Western Digital, Sandisk, and Lam Research as tech bargains.
Some of these stocks have had spectacular gains as Autodesk and Akamai are up 26% and 29% respectively over the past month. A look at the weekly chart and technical studies will help investors as well as traders determine whether these stocks have now made a major turn.
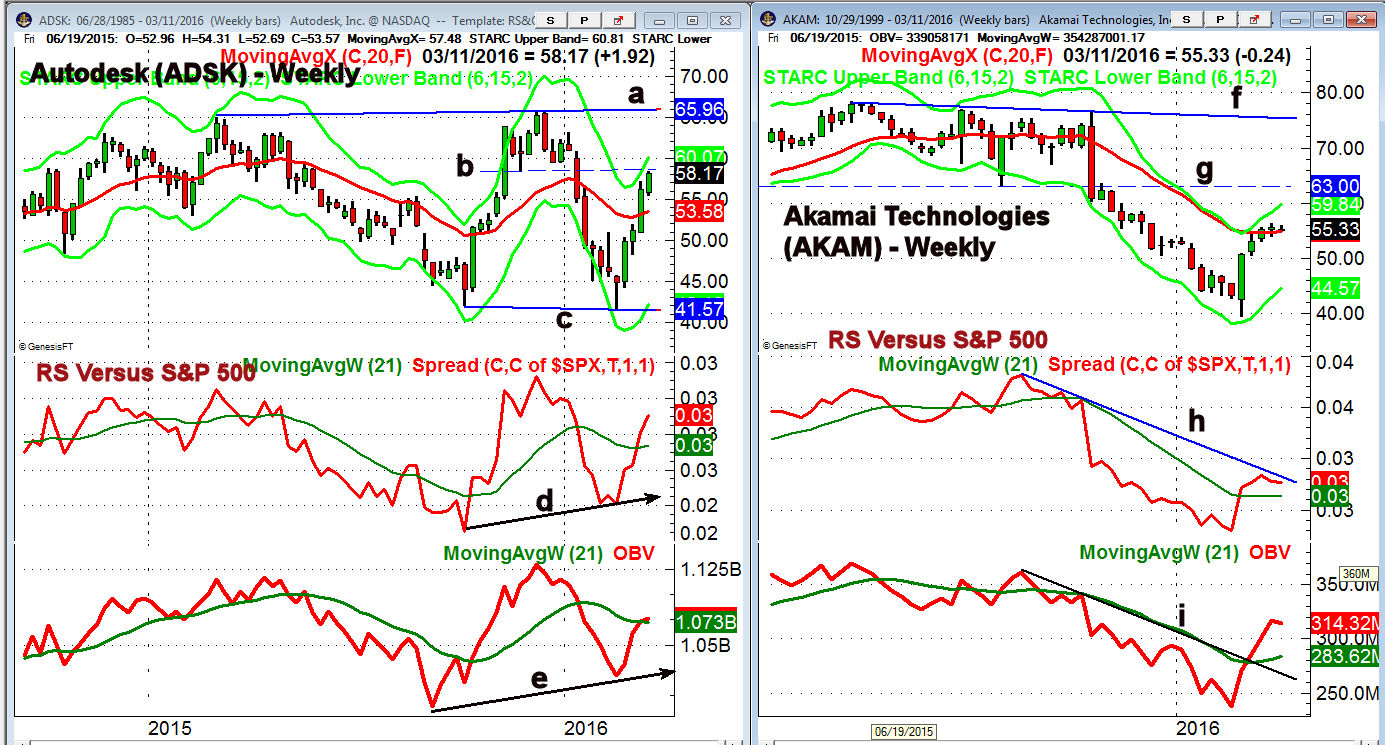
Autodesk (ADSK) made marginal new lows at $41.60 in early February before rallying sharply for the past four weeks.
- The resistance at $58.55, line 1, has now been reached with the weekly starc+ bands a bit higher at $60.07.
- There is additional resistance now at $63.16 with the upper boundary of the trading range, line a, at $65.96.
- The weekly relative performance did form higher lows, line d, in early February. The RS line is now well above its rising WMA.
- The weekly OBV also formed a positive divergence at the lows but has just made it barely above its WMA.
- The 20 week EMA is now at $53.56 with the 20 day EMA at $52.06. This represents a zone of good support.
- A daily close below $48 would be a sign that ADSK was ready to test the February lows.
Akamai Technologies (AKAM) formed a major weekly reversal in early February as after a low $39.43 it closed the week at $50.76. It has made little upside progress since as it is now bumping into its 20 week EMA.
- The weekly starc+ band is at $59.81 with much stronger resistance in the $63 area.
- The resistance from the triple top, line f, is in the $76 area.
- The weekly relative performance has moved above its WMA but is still below the long term resistance at line h.
- The weekly OBV moved above its downtrend, line i, and its WMA on February 19th.
- It will be important that the OBV holds above its rising WMA on a pullback.
- The daily studies are now slightly negative with retracement support now in the $49.76 to $47.76 area.
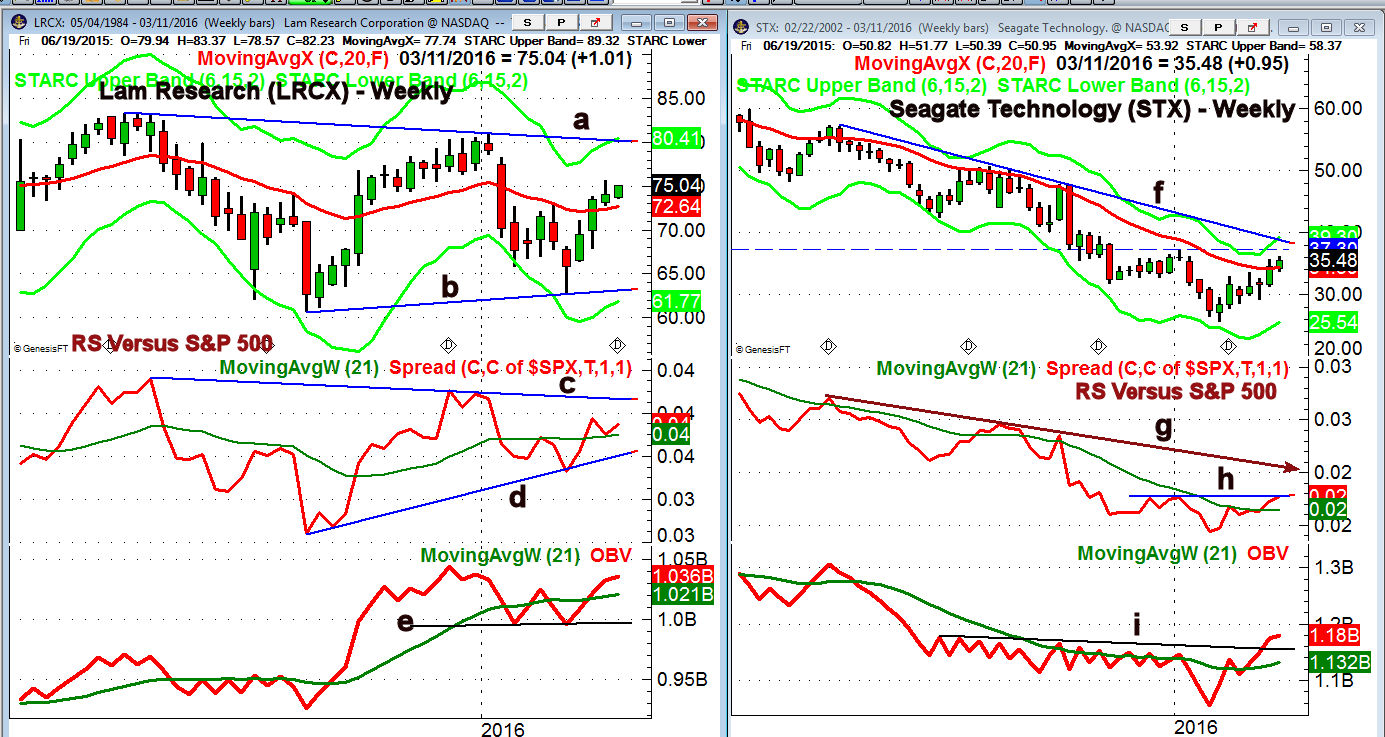
Lam Research (LRCX) is up just over 9% in the past month as it has just been holding above the 20 week EMA. There is major resistance in the $80-$81 area along with the weekly starc+ band .
- From the monthly chart the recent trading range looks to be part of a continuation pattern that favors an eventual upside resolution.
- The weekly RS line has been acting stronger than prices, line d, as it has just bounced from its WMA.
- A move in the relative performance above the resistance at line c, would be bullish.
- The weekly on-balance-volume (OBV) appears to have formed a double bottom, line e, before moving strongly above its WMA
- The OBV is already close to making a new high as it has acted stronger than prices.
- The daily chart reveals a sideways trading range so far this month with the 20 day EMA at $72.03.
- There is key support now at $67.91
Seagate Technology (STX) has been in a well established downtrend since early in 2015. It dropped to another new low in late January at $25.74 before rallying.
- STX has just made it slightly above its 20 week EMA with chart resistance next at $37.30.
- The weekly downtrend is now at $38.65 with the starc+ band at $39.23.
- The weekly RS line has just rallied up to key resistance, line h, that needs to be overcome to signal that STX is now leading the S&P 500.
- The longer term resistance for the relative performance is at line g.
- The OBV has been able to overcome the resistance at line i, which is an encouraging sign.
- It will be important to watch the OBV on any pullback.
What to do? The last of Barron's bargain picks, Western Digital (WDC) has had a very weak rally as it is still well below its 20 week EMA $54.62. Of the other stocks on the list; Micron Technology (MU), NetApp (NTAP), eBay (EBAY), Cisco Systems (CSCO), Yahoo! (YHOO) and Nvidia (NVDA) all appear to have had rebounds with their downtrend. They should be watched as the market corrects.
Of the four stocks Lam Research (LRCX) looks the most interesting technically and I will be looking for a good entry point as the market corrects. LAM as well as these tech stocks are part of my weekly scans for my Viper Hot Stock Report where I give specific trading advice on the Nasdaq 100 and IBD Top 50 stocks
Comments
comments