

Now that the Spyder Trust has surpassed the $202 level with a Monday high of $203.04 investors seem to have lost much of their investing fear that they had in January. Still the severity of the drop will likely keep many out of the stock market until much later in the year.
The major swing in sentiment from a month ago along with recent narrowing of price ranges means it is not a time to be complacent. In "Three Sentiment Indicators Investors Should Follow" I suggested that there were three measures of investor sentiment that should be followed for signs that investors may have become complacent.
One was the Rydex Cash Flow Ratio which has dropped from a peak of 1.38 on February 1st to a current reading of 1.05 which was a decline of 24%. Rydex Inverse S&P 500 2x Strategy Fund (RSTPX) has dropped over 18% from its February 11th high. The bullish% of individual investors according to AAII has risen from a January low of 17.9% to 37.4% last week. We get a new reading on Thursday and it could move to the 43%-45% area. The CNN's Fear & Greed Index has risen from a reading of 21 (Fear) to 73 which is now in Greed territory.
Though the A/D lines have continued to make new highs the NYSE McClellan oscillator peaked at +328 on March 1st but has been diverging from prices since then as it is now at +55. Additionally the NYSE Composite, June S&P futures and iShares Russell 2000 (IWM) formed dojis on Monday so a close below Monday's lows will be a sign of weakness.
These factors heading into the widely watched FOMC announcement and press conference are likely to cause an increase in volatility. Recently the initial reaction to the FOMC language has been reversed the following day as rallies on the announcement have been met with selling the next day. In last week's "Bear Market Rally or More?" I suggested that those who had some nice profits from the rally should consider taking some of those profits.
Spyder Trust (SPY) is now down just under 1% for year but there are a number of stocks that are doing considerably better. Four stocks that are outperforming the SPY are also on the IDB Top 50 list but can they continue to lead the SPY higher?
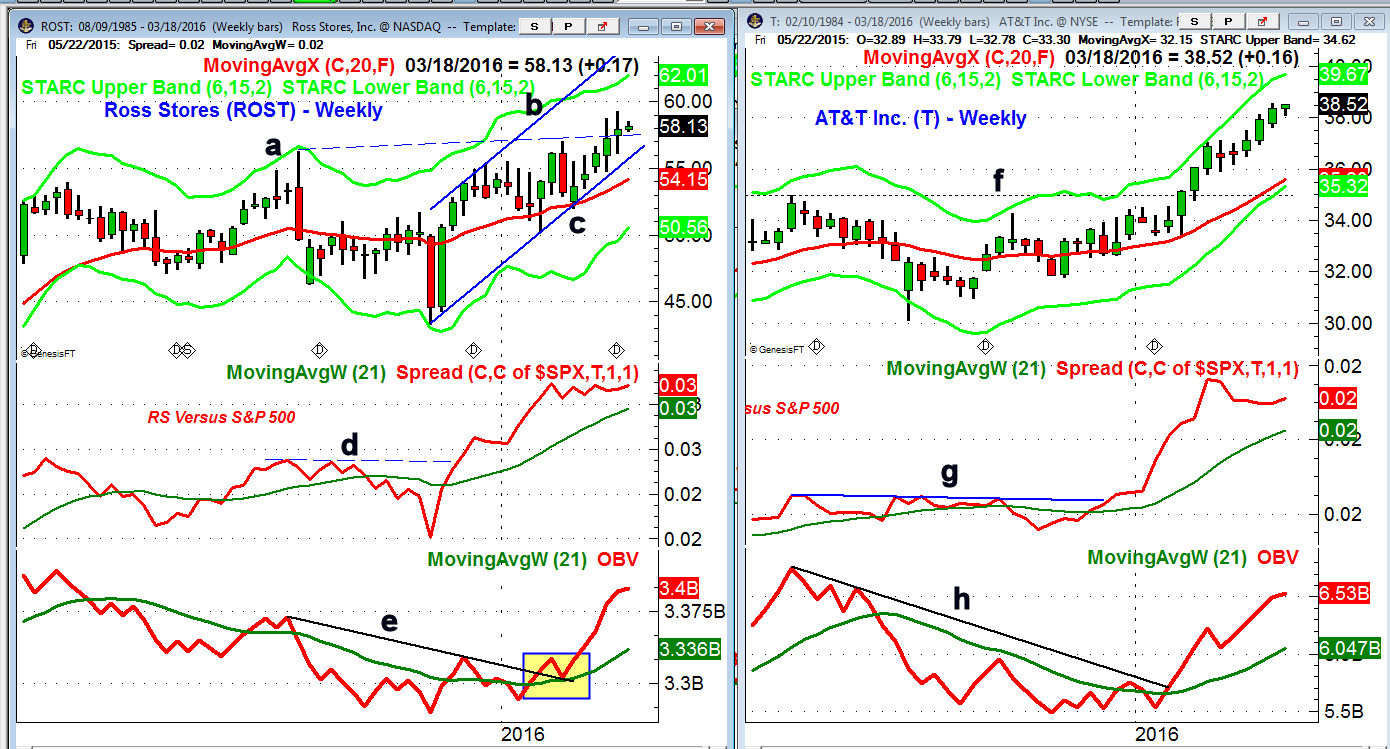
Ross Stores (ROST) is up 8.3% YTD as it broke through weekly resistance, line a, three weeks ago. The stock has been churning recently in the $57.50-$59.30 area and this makes a near term pullback more likely.
- Though a pullback to $55-$56 area is possible over the near term the upper trading channel and starc+ bands are in $62-$64 area.
- The relative performance broke through resistance ( line d) in early December signaled that it was becoming a market leader.
- The RS line still looks strong and a drop to its WMA could present another buying opportunity.
- The OBV broke its downtrend, line e, in January and dropped back to its WMA (highlighted ) which created a good buying opportunity.
- Viper Hot Stock traders went long on this pullback and took profits on strength over the past week.
- The OBV could pull back to its WMA on a correction.
AT&T Inc. (T) is up 13.3% YTD and has a current yield of 4.9%. It closed above weekly resistance, line f, in the latter part of January and quickly rallied to its weekly starc+ bands. After two weeks of consolidation it accelerated to upside.
- It has now reached the monthly pivot resistance at $38.52 with the weekly starc+ band at $39.67.
- There is minor support now at $37-$37.60 with the 20 week EMA at $35.60.
- The weekly relative performance broke though strong resistance, line g, in December as it began to lead S&P 500 higher.
- The RS line still looks strong and is well above its rising WMA.
- The on-balance-volume (OBV) broke its downtrend, line h, on January 15th and has since surged to upside.
- The OBV is well above its WMA so a pullback cannot be ruled out.
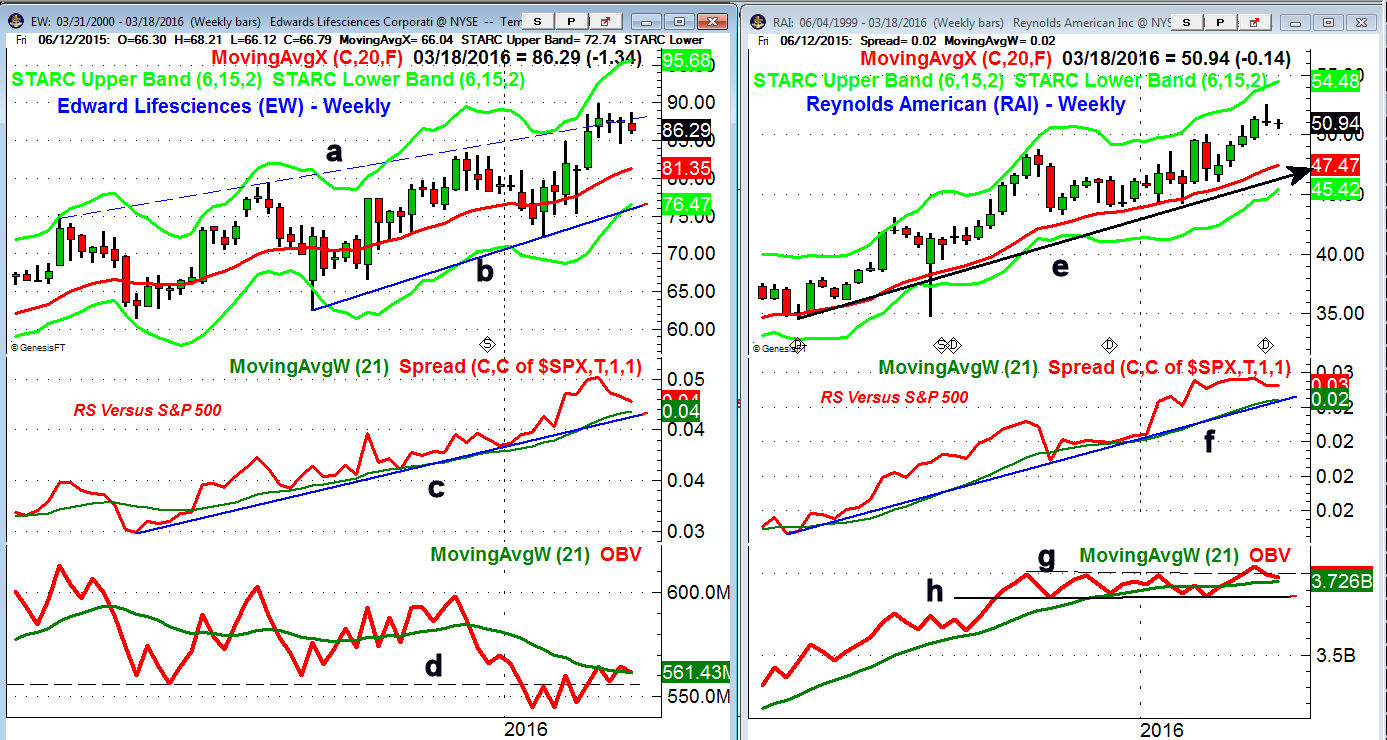
Edward Lifesciences (EW) surged to the upside five weeks ago as it reached trend line resistance at line a. It is up 11.3% YTD but has made little upside progress over the past two weeks. There is monthly pivot resistance at $92.85 with the weekly starc+ band at $95.68.
- There is initial weekly support in the $83-$84 area with the 20 week EMA at $81.35.
- The relative performance has been in a strong uptrend, line c, since last September.
- The RS line is now pulling back to its WMA.
- The OBV has been lagging prices as it dropped below support, line d, in early January.
- The OBV is now just barely above its WMA.
- The daily studies (not shown) are now slightly negative.
Reynolds American (RAI) formed a doji last week so a weekly close below $50.80 will generate a short term sell signal. It is up 11.3% YTD and hit monthly pivot resistance at $52.26 last week.
- On a drop below the $49 level it could decline back to the 20 week EMA at $47.47 with the long term uptrend, line e , a bit lower.
- The relative performance had started a clear uptrend in July and has stayed above weekly support at line f.
- The RS line did make new highs with prices a few weeks ago.
- The weekly OBV moved out of its trading range, line g, a few weeks ago which was a sign of strength.
- The OBV now has major support at line h.
- On the daily chart there was a doji sell signal with last Friday's close so a further pullback is likely.
What to do? Given the strong YTD gains these four stocks are likely to correct over the next few weeks as EW and RAI do look the most vulnerable. Though ROST and AT&T may also correct the weekly analysis makes them the most attractive for new purchase on a drop back to support. I will be watching both for clients of my Viper Hot Stocks service.
Comments
comments