

It was another week of almost daily Executive Orders on a wide range of topics that have spurred much second-guessing but have not derailed the stock markets push to the upside. In the rampant hypocrisy that US voters are all too familiar Republican leaders applauded his orders after criticizing Obama as an "emperor" for his use of orders.
As expected, based on the strong readings from the market internals last month, the Dow Industrials surpassed the 30,000 level. Now this is not one of those alternative facts but is based on the analysis of the Wall Street Journal.
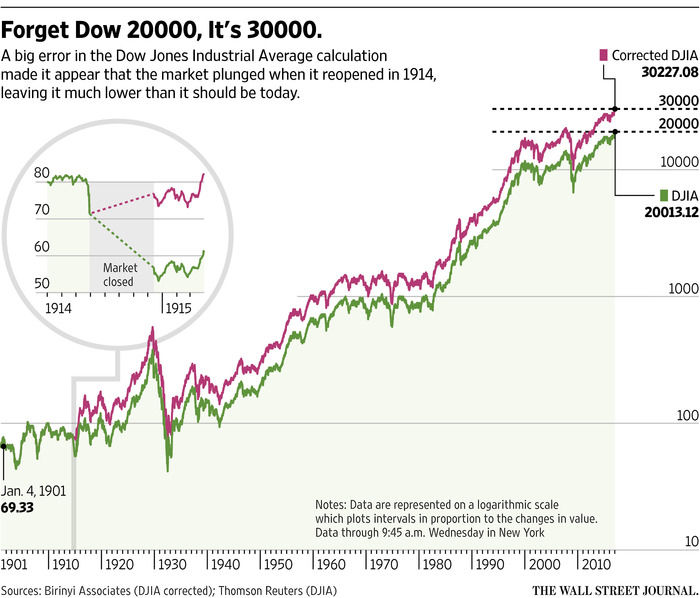
In their article "We’re Already at Dow 30000, You Just Don’t Know It" they uncovered a incorrect adjustment of the average during WWI, as noted in the chart, that if corrected now would mean that the Dow is now really above 30,000.
Most market technicians will agree that while the Dow Industrials is a poor measure of the overall market's health it can be a good barometer of public sentiment. Many analysts had turned cautious on the market in January as apparently they were following "the buy the election sell the inauguration" philosophy.
It is important to note that the S&P 500, Nasdaq Composite and Nasdaq 100 also made new highs last week. The market tipped its hand last Monday when the market internals were positive even though the market averages were lower. The strong action Tuesday and the new highs in the S&P 500 and Nasdaq 100 A/D lines suggested the market's correction was over (see Tweet).
There were some ETFs that reached their daily starc+ bands and Viper ETF traders took some partial profits on Wednesday. There were also some ETFs, like the homebuilders, that are showing early signs of becoming new market leaders.
As discussed in Saturday's Market Wrap section the overall market action is positive but it may take another week or so before the A/D lines can signal upward acceleration. The new highs have been accompanied by more bearish commentary as some of the high profile TV traders that have not been bullish are still not convinced.
It is understandable that many are skeptical as to whether the flurry of Trump actions will actually lead to real economic growth. In fact we will be lucky if we get any hard data of new economic growth from his policies this year.
Still the burst of enthusiasm will not dissipate for some time and I think there will be clear evidence before we see a Trump bear market or meaningful correction. Therefore investors should stay with stocks until there are clear warning signs and here is what to look for.
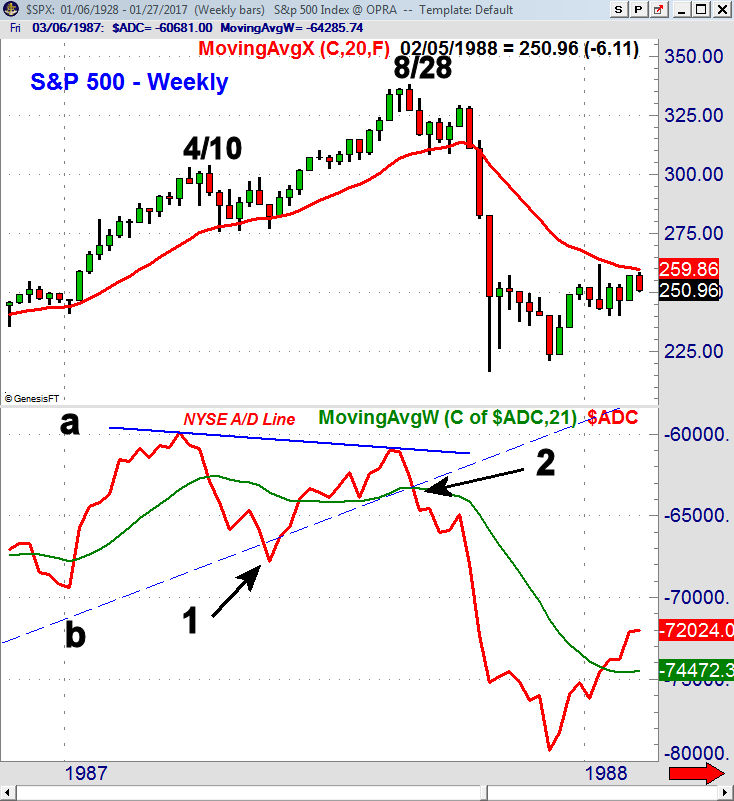
As I pointed last week in "The Reagan Markets" the economy and stock market saw several wide swings in the Reagan years. Besides the bear market bottom in 1982 the most significant market development was the 1987 crash. The weekly chart shows that the S&P 500 rallied 27% in early 1987 prior to a 9% pullback to the 20-week EMA. The next rally lasted fifteen weeks and took the S&P 500 over 22% higher.
The NYSE advance/decline line (One Indicator Stock Traders Must Follow) gave a much different picture of the market as it peaked on April 10th. On the spring correction the A/D line dropped below the support at line b, that went back to the 1984 low. This was the initial warning. As the S&P 500 was making its high the week of August 28th, the A/D line was forming lower highs, line b.
The A/D line broke its support again in early September and the A/D line was dropping sharply (point 2) as the S&P rebounded in early October. This confirmed the bearish divergence. From the early October high to the October low the S&P 500 dropped 34.2%.
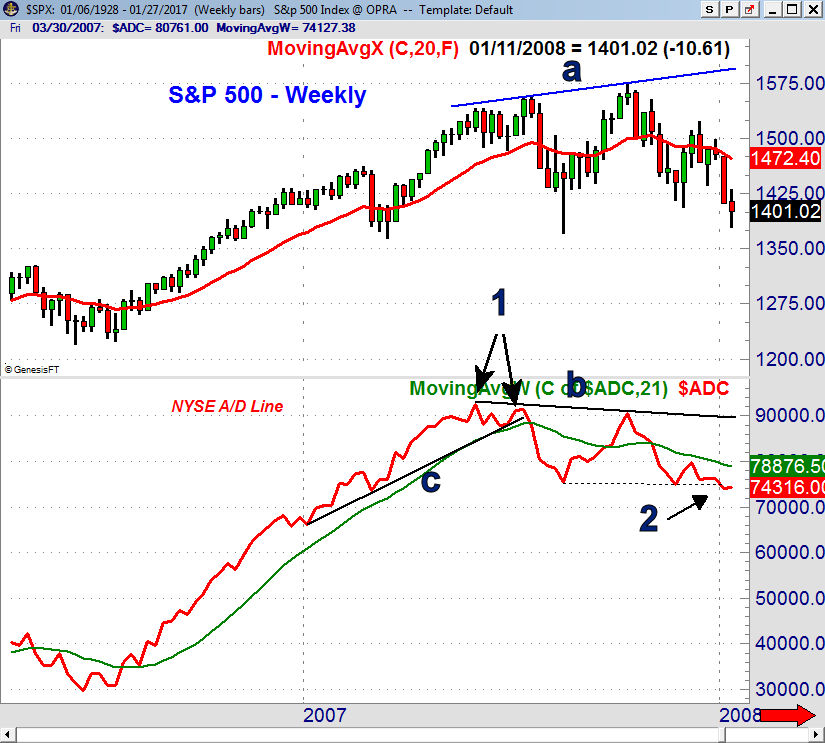
There were also several warnings before the bull market top in 2007. The correction on fears over a slowdown in China pushed the S&P 500 lower into early March of 2007. From the March lows the S&P 500 gained 14% before it topped the week of July 20th.
In just over four weeks the S&P 500 dropped 11.9% which was consistent with the six-week divergences (point 1) in the A/D line. On the decline the A/D line dropped well below its WMA and violated the support at line c.
From the August low, the A/D line rallied sharply moving back above its WMA in late September. As the S&P 500 was making a new high, line a, the NYSE A/D line was forming a lower high. This negative divergence, line b, warned of a bear market. In early 2008 the A/D dropped below additional support (point 2) which was another sign of weakness.
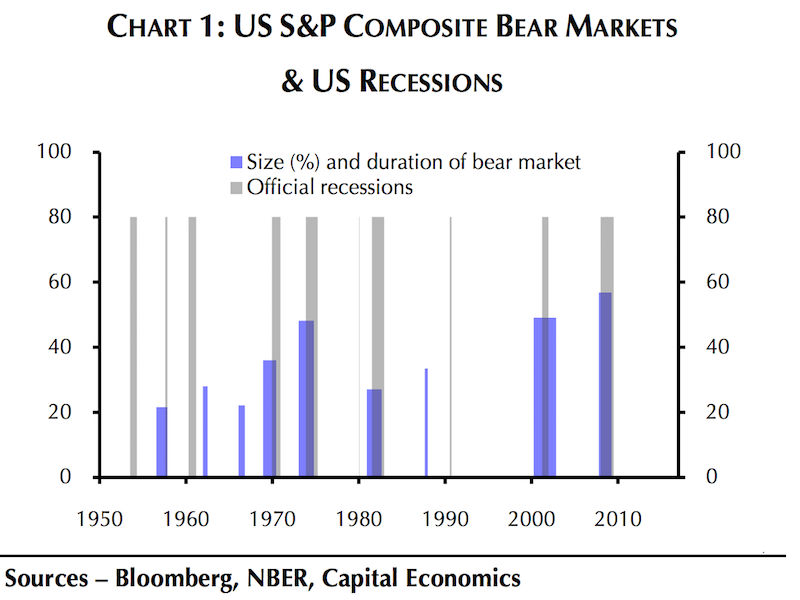
Corrections of 10% or more are generally preceeded by 4-6 week divergences in the A/D line. Bear markets are often completed after the A/D line forms divergences that last 2-4 months or longer. The majority of bear markets since 1950 have coincided with recessions as the chart indicates.
In the 1950's and 1960's there were recessions without a bear market and the 1987 decline did not coincide with a recession. The recession in the early 1990's did not trigger a bear market.
In summary I would expect to see a correction of 10% or maybe more by the fall of 2017 but it should come from higher levels. After such a correction the market will then have to make further new highs before bear market warnings are possible.
The Economy
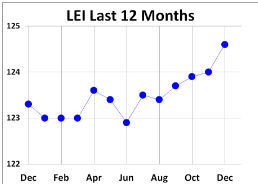
The data last week was consistent with an improving economy even though Friday's preliminary reading on 4th quarter GDP at 1.9% was lower than expected. There are certainly no signs of a recession as one of the economic indicators that I follow the most closely, the LEI (Leading Economic Indicators) rose 0.5% in December. The chart shows a solid uptrend and there are no signs it is topping out.
The flash PMI Manufacturing Index, Richmond Fed Manufacturing Index and the Chicago Fed National Activity Index were all better than expected last week. Existing Home Sales were a bit lower as were the Durable Goods. Consumer Sentiment was still strong at 98.5.
On Monday we have Personal Income and Outlays, Pending Home Sales and the Dallas Fed Manufacturing Survey. These are followed on Tuesday by the S&P Corelogic Case-Shiller HPI, Chicago PMI and Consumer Confidence.
The ISM Manufacturing Index and PMI Manufacturing Index are out Wednesday along with the ADP Employment Report. The monthly jobs report is out on Friday with the PMI Services Index, Factory Orders and the ISM Non-Manufacturing Index.
Interest Rates & Commodities
The yield on the 10 Year T-Note rose last week suggesting that the pullback from the December highs was over. A close in yields above 2.60% will confirm a new uptrend and such a move may be triggered by the continued improvement in the economic data.
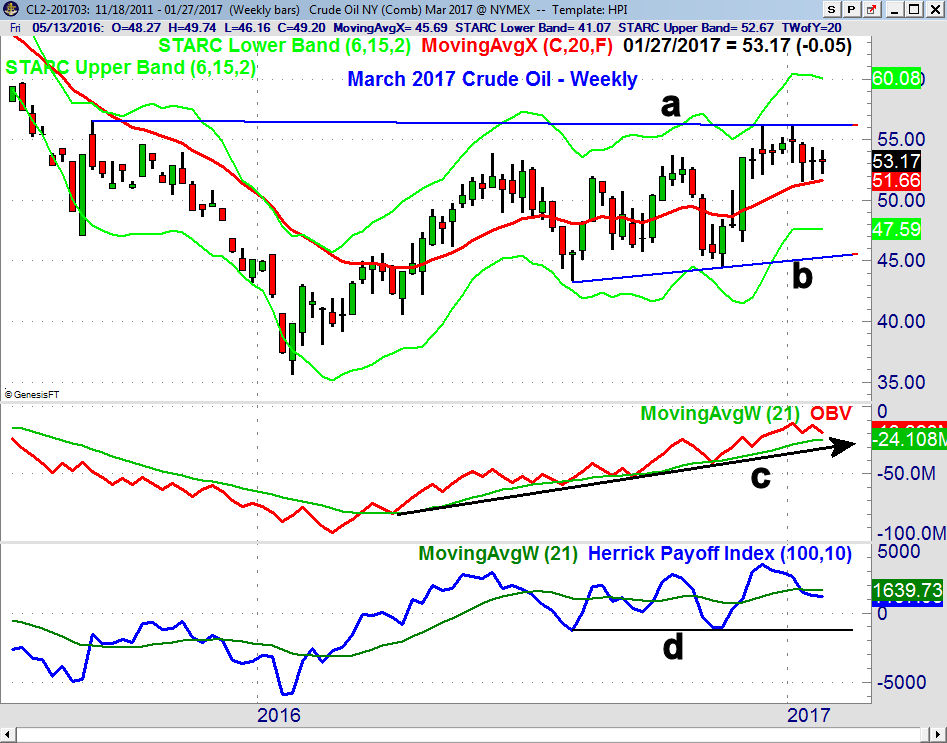
The March crude oil contract was a bit lower last week as the range was tighter than the previous two weeks. There is still key resistance in the $56 area, line a, and a move above this level would really get the market's attention. Prices are still holding above the 20-week EMA at $51.66.
There is long-term support in the $45 area, line b. The weekly OBV is still above its WMA and is in a long term uptrend. The HPI made a new high in late 2016 but has dropped slightly below its WMA. It is still above the key support at line d.
Gold and the gold miners closed last week below the highs and they may see a deeper correction over the near term. Sentiment on gold seems to be quite negative as apparently sales dropped heading into the Chinese New Year. Also the COT data reveals that money managers are not very long gold.
Market Wrap
The major averages put in a strong performance last week as the Dow Industrials gained an impressive 1.3% and the broad based S&P 500 was up 1.03%. Leading the major averages were the Dow Transports with a gain of 2.38% and this confirmed my bullish analysis from January 18th.
The Nasdaq Composite was up 1.90% and the Viper ETF favorite since December, the Nasdaq 100 was up 2%. The market internals were better than 2-1 positive and the weekly A/D lines on the NYSE Composite, S&P 500 and Nasdaq 100 all made new highs.
The technical action and charts since the mid-December highs had suggested that the market was just consolidating and not topping out. The sideways to lower trading lasted just long enough to make many nervous as $9 billion had moved out of stock funds in the past three weeks and 6.3$ billion a week ago.
Those who followed the crowd and waited for confirmation that the correction was over did not get a good price as $2.2 billion flowed into US stocks last Wednesday. Many of the market tracking ETFs gapped higher on Wednesday and got a much higher price than those who have been buying for the past month.
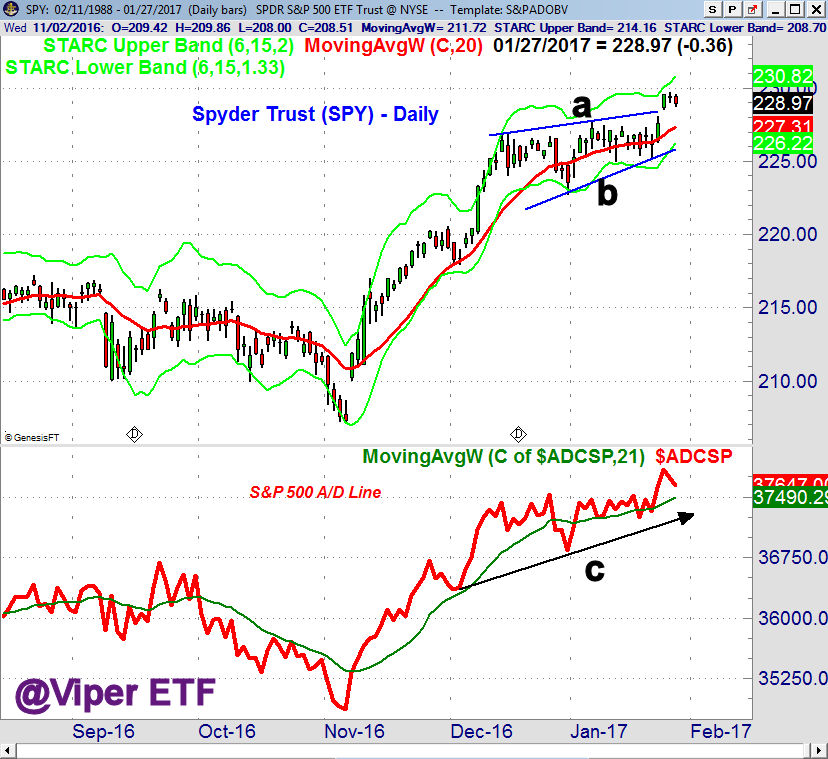
The Spyder Trust (SPY) broke out of its flag formation, lines a and b, on Wednesday. This is a typical continuation pattern or a pause in the uptrend. The formation has upside targets in the $232-$234 area which corresponds to the weekly starc+ band. There is quarterly pivot resistance at $240 and the yearly projected resistance from a recent Viper Trading Lesson is at $241.26.
The S&P 500 advance/decline line broke out ahead of prices as it had been in a solid uptrend since early December, line c. A strong close this week will suggest prices are ready to accelerate on the upside. The weekly A/D line has also made a new high.
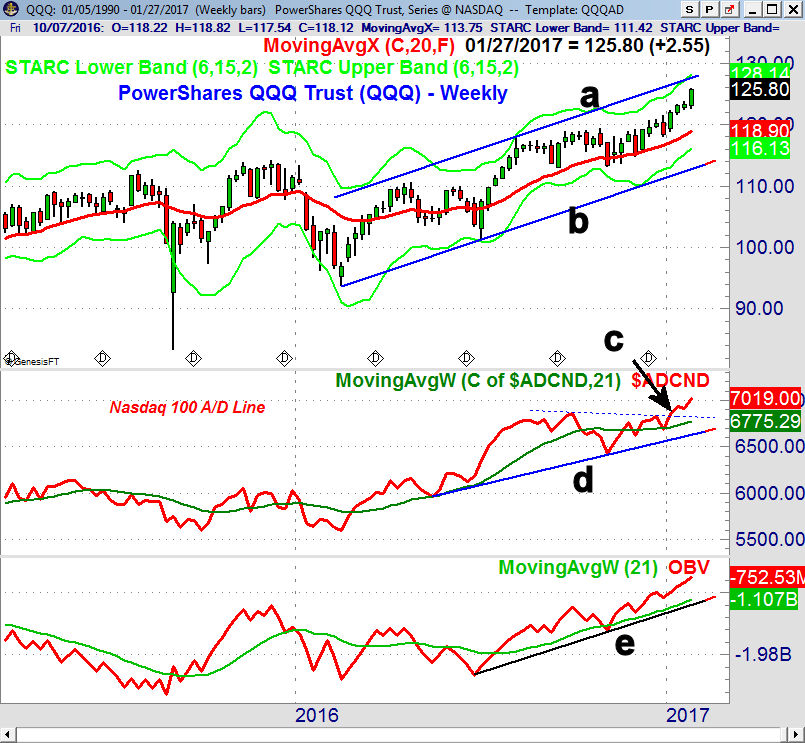
The PowerShares QQQ Trust (QQQ0 had a very strong close last week with the upper boundary of the trading channel, line a, and the weekly starc+ band at $128.15. This is 1.8% above Friday's close and the yearly pivot resistance is at $128.73.
The daily chart shows that QQQ formed dojis on Thursday and Friday so we may see a pause in the uptrend as it has been leading the market higher, gaining over 6% since the end of the year. There is initial support in the $124.50 area with the rising 20-day EMA at $122.93.
The weekly Nasdaq 100 A/D line broke out to the upside in early January, point c, and it has not turned sharply higher. (This is another example of the power of the A/D line analysis which is often a focal point of my 1-on 1 teaching sessions)
The iShares Russell 2000 (IWM) tested the upper boundary of its recent trading range on Wednesday before pulling back late in the week. A strong close above $138 is needed to confirm an upside breakout. The close this week will be important.
What to do? The new highs last week seem to be distrusted by many which is a good sign. According to AAII the bullish % dropped 5.4% last week to 31.6% which is consistent with a correction. I would expect this to change in the next survey. As I noted last week a "higher close this week with positive A/D numbers will indicate the Trump rally has resumed".
The clearly positive intermediate term analysis has now been joined by positive daily signals from all except the Russell 2000 and Dow Industrial A/D lines. There are many economic reports this week ending with the monthly jobs report. I do not expect much from the FOMC this week though it may cause an increase in volatility.
In order to alter the short-term bullish outlook the market would have to drop sharply for several consecutive days with very negative A/D ratios. A more likely scenario is for the stock market to move even higher in February as it is a seasonally strong period.
If you would like specific buy and sell advice you might consider my Viper ETF Report or the Viper Hot Stocks Report . Both include regular Trading Lessons and are $34.95 each per month
Comments
comments