This article has been updated through a YouTube video available at this link
In training new investors and traders I always urge them to look at candle charts as they can give you important information that is not available from bar charts. The formation that I play the most attention to is the doji candle. It is formed when the open and close of the time period are about the same.
This is a sign that a market is indecisive as the bulls and bears have not been able to move the market very far from the opening price. The behavior of the market after the doji is formed can be helpful in determining a change in trend.
As is the case with all technical methods the longer time periods have more reliable signals. Therefore the monthly signals are more reliable than the weekly and the weekly are more reliable than the daily signals.

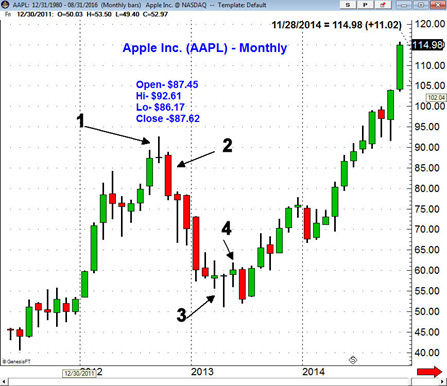
The signals occur when the market closes either above the doji high or below the doji low. Part of my regular daily, weekly and monthly routine is to look for the formation of dojis. The monthly chart of Apple Inc. (AAPL) from 2012 to 2016 demonstrates several good examples of doji signals. In September 2012 AAPL opened at $87.45 and closed at $87.62 thereby forming a doji, point 1.
In October 2012 (point 2) AAPL closed at $78.20 which was well below the doji low at $87.62 which triggered a sell signal. This meant that it would take a move above the doji high of $92.61 to reverse this signal. In April 2013 (point 3) AAPL had dropped to a low of $51.11 but then rallied to close at $58.77. This was very near the month's open at $58.65 so a doji was formed.
The large gap between the low and the close is called a tail and suggests that the market had stopped out many longs at the lows before it rallied. In May AAPL closed at $60.08 (point 4) which was above the doji high of $58.77. Therefore a buy signal was generated that would only be reversed on a drop below the doji low of $51.11. The following month AAPL reversed to close at $52.98 but with a monthly low of $51.95 the doji buy signal was still intact. Then in July the stock rebounded to close at $60.46 which was the start of a rally to the 130 area.

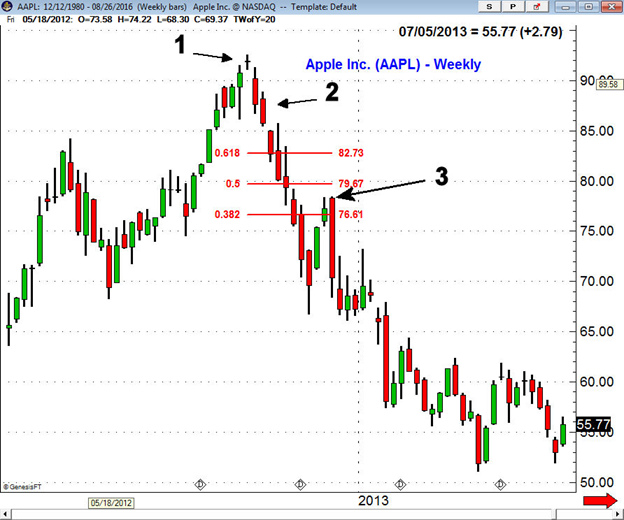
By the time the monthly doji sell was generated in October 2012 with the close at $78.20 AAPL was already down 10.7% from the prior month's close. This is why it is important to also look for doji signals on the weekly charts. The week of September 21, 2012 (point 1) AAPL formed a doji with a close at $91.96 and a low of $91.11.
The following week AAPL opened at $90.22 and closed the week at $87.62 which was well below the doji low as a sell signal was triggered with a stop above $92.61. The next week AAPL rallied as high as $88.89 before closing at $85.72. By April 2013 AAPL had dropped as low as $51.11.
Tom teaches about weekly doji buy and sell signals as part of his mentoring program
Comments
comments