

It has been a rough week for both investors and traders after the surprising UK vote over a week ago. In the June 18th column "The Week Ahead: Is The Fear Trade Your Best Bet Now?" I made the case that investing based on a potential vote in favor of leaving the European Union was not a good idea.
My market analysis at the time indicated that the "market clearly seems positioned for a No vote on June 23rd". It has been my experience that market shocks and Black Swan events must be viewed in the context of the market's long-term trend.
When such events take place in bear market investors should have very light long positions in stocks so any damage should have a limited impact. The fact that the monthly NYSE Advance/Decline line made a new high in May and was acting stronger than prices provided strong evidence that the stock market's major trend was positive.
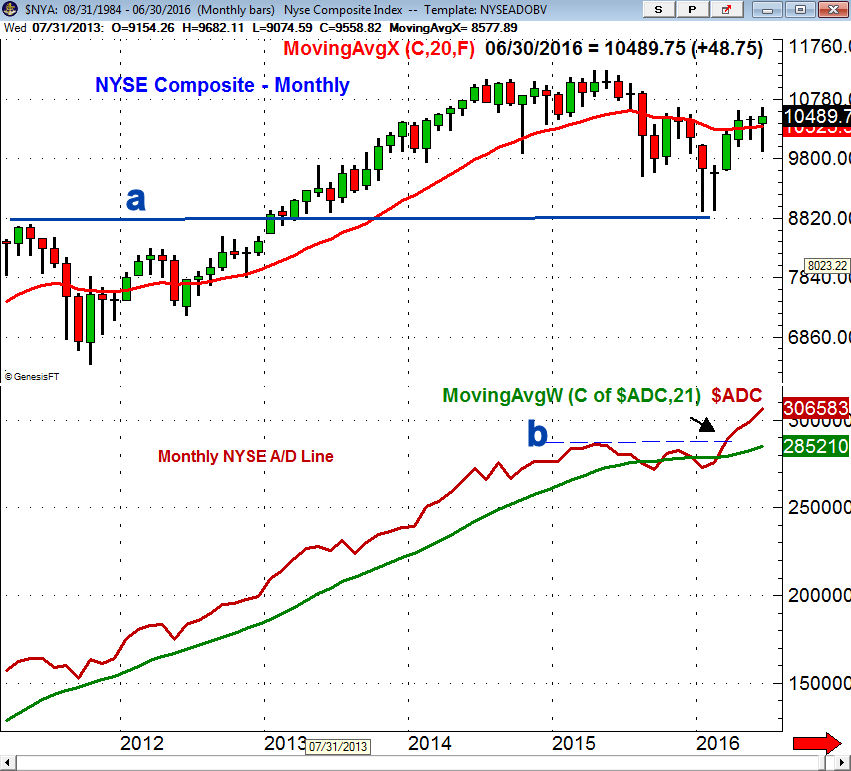
The A/D line made another new high in June and continues to act very strong after breaking through the resistance at line b. The NYSE Composite is still well below the major resistance in the 10,900 to 11,248 area but the action of the A/D line does favor new highs this year in the NYSE Composite. Both the daily and weekly A/D lines have also made new highs and the daily A/D line held support even while stocks were plunging.
Those who went short ahead of the vote had to have taken profits quickly as the market rallied very sharply from last Monday's low. Given the large number of articles that were proclaiming that this was the start of a major new decline I doubt many closed out their short positions until the major averages were well above Monday's lows.
The biggest mistake investors can make is to change their investment plan or strategy because of an unexpected event. I have been making the case for several months that even though the economy was not as strong as I would like there were no signs of a recession on the horizon. After the initial market decline many began to realize that the UK would not be leaving the European Union for a quite a while and therefore any impact on their economy might not emerge for a few years.
For many investors using weekly closing prices on long-term positions can often help them avoid being stopped out when the market has a very sharp decline. I follow the quarterly pivot (QP) levels quite closely as they are reported for the key ETFs each week in the Viper ETF Report.
I have found that a Friday close above or below the quarterly pivot can be a good indicator of a trend change. It can help the investor avoid the daily market noise that often can scare them out of their positions and keep them in the long-term trends.
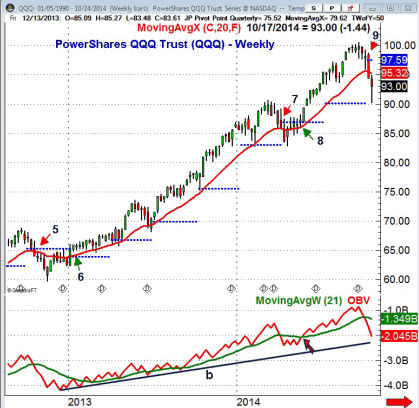
This chart of the PowerShares QQQ Trust (QQQ) from an earlier article on quarterly pivots shows that it closed back above the QP in early 2013 (point 6) generating a new positive signal. There were several sharp setbacks during this 22-month period but the quarterly pivots kept Investors primarily on the long side until early October 2014. There was a five-week move into the sell mode (point 7 ) in the second quarter that was reversed after five weeks (point 8) at no net loss. Using this approach investors were able to catch most of the 50% rally.
Often times a market will drop below its quarterly pivot during the week but not close below it on Friday. In late January 2014 the stock market had it's worst week since 2011 as concerns "about an economic slowdown in China pressured markets around the globe". The S&P 500 lost over 6% in just 14 days and there were clear evidence of panic liquidation.
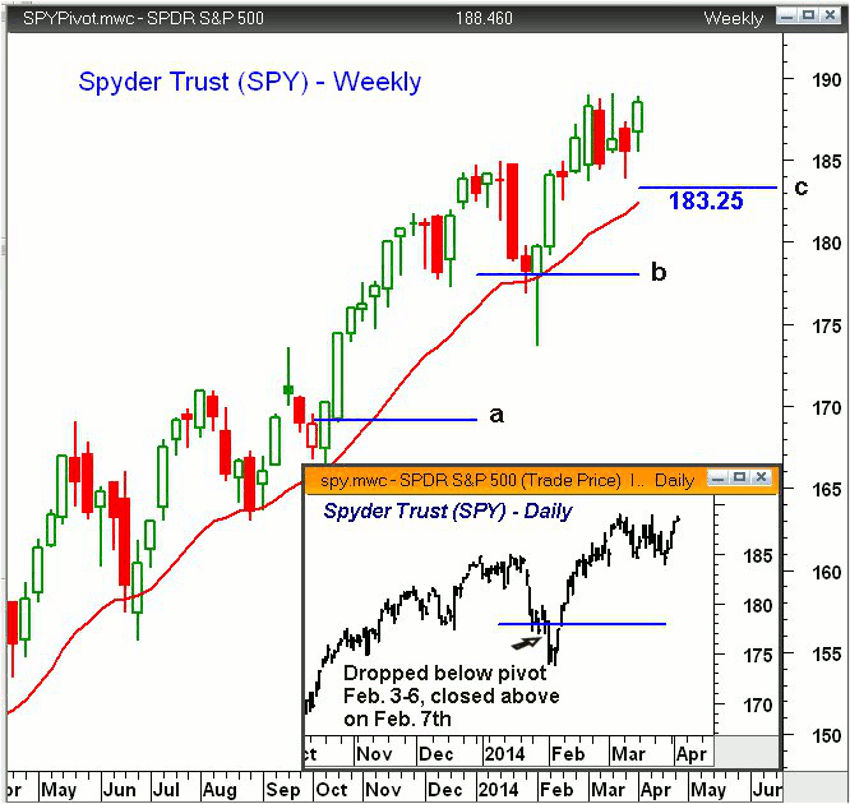
The Spyder Trust (SPY) did not have a weekly close below its quarterly pivot in 2013. On the chart, line a, represents the fourth quarter pivot for 2013, which was at $167.72. In early October 2013, SPY had a weekly low of $162.92 but rebounded sharply to close the week at $168.60.
For the first quarter of 2014, the pivot was at $177.97, line b. The daily chart insert shows that the sharp drop, on Monday, February 3, took the SPY well below the quarterly pivot with a weekly low at $172.95. There were signs at the time that this could be a panic low, as there was increasing bearish sentiment and the ARMS Index hit an oversold extreme of 3.42.
The SPY was able to rebound by the end of the week to close at $178.89, which was well above the quarterly pivot. Throughout the 2nd quarter of 2016 the Spyder Trust (SPY) stayed well above the quarterly pivot at $197.50. It came close last Monday with the low of $198.65 but closed Friday above the new 3rd quarter pivot of $206.88.
Clearly the two-day decline was sharper than I expected as most of our long ETF position were stopped out on Friday June 24th. These were relatively new positions and therefore the risk was too high to comfortable use the quarterly pivot strategy instead of stops.
Over the years I have been very successful in placing stops that have not be hit on panic declines but not this time. Careful management of the risk has played a large role in attaining long term profits but still the 2.7% loss in the SPY position was no fun. The heavy level of long liquidation was characteristic of panic selling.
In addition to providing market analysis my goal over the past 30 years has been to educate my readers so that they can gain the necessary skills to become their own expert. I have always emphasized that it is very important for each investor to develop a clear investment plan.
Now this can be difficult on days like June 24th when the Dow closed down 610 points but having the discipline to be patient and not panic is the best strategy for investors in a financial crisis.
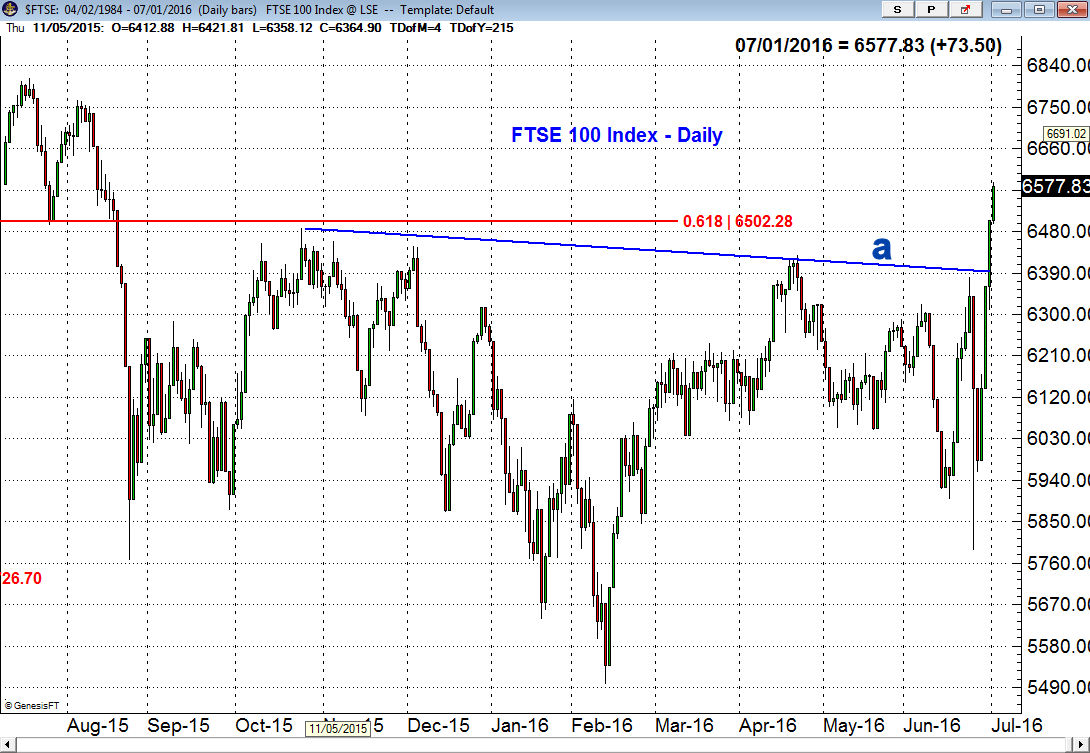
It has clearly been a wild week and as I discuss more in the Market Wrap section the volatility is likely to remain high. The chart of the import heavy FTSE 100 Index shows that after dropping of a low of 5788 on Friday June 24th it then reversed to the upside and broke through resistance at line a. This breakout is likely significant and the close was also above the key 61.8% Fibonacci retracement resistance from the 2015 high.
Many of the other global markets are still trading below resistance but I continue to think that the analysis of the US stock market still is the determining factor for investors.
The Economy
Despite the view of many analysts that a new global recession was imminent the overall economic data was surprisingly good last week. The Dallas Fed Manufacturing Index was weak again last month but did show some improvement while final reading for 1st quarter GDP came in a 1.1%. The early estimates for the 2nd quarter GDP is for 2% growth which is not too bad.
Corporate profits came in at -2.3% which was better than the earlier estimate of -3.6%. Factset is looking for the fifth quarter in a row of negative earnings with their 2nd quarter estimate of -5.2%. Recently the earning have not been as bad as their estimates and a positive surprise in earnings could push stocks much higher.
More impressive was the 6% jump in June's Consumer Confidence which was the best reading since October of last year. The Pending Home Sales Index fell 3.7% which reversed April's gains.
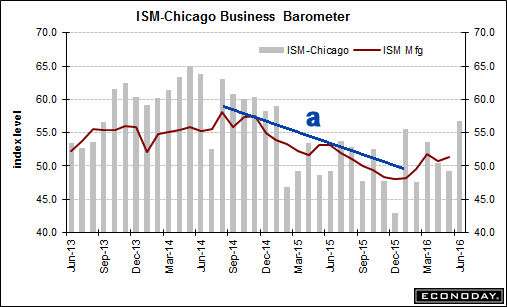
The Chicago PMI surged to 56.8 which was the highest reading since March 2015 and much better than the consensus estimate of 50.5. The ISM Manufacturing Index was also better than expected at 53.2 which is not reflected in the chart. The downtrend in the ISM, line a, was broken in March. Though it is well above the key 50 level it is still relatively low but it was the best reading since February 2015. The PMI Manufacturing Index at 51.3 was not as strong.
On Tuesday was get Factory Orders followed on Wednesday by the ISM Non-Manufacturing Index and the latest FOMC minutes. The ADP Employment Report is out on Thursday with the monthly jobs report on Friday.
Interest Rates & Commodities
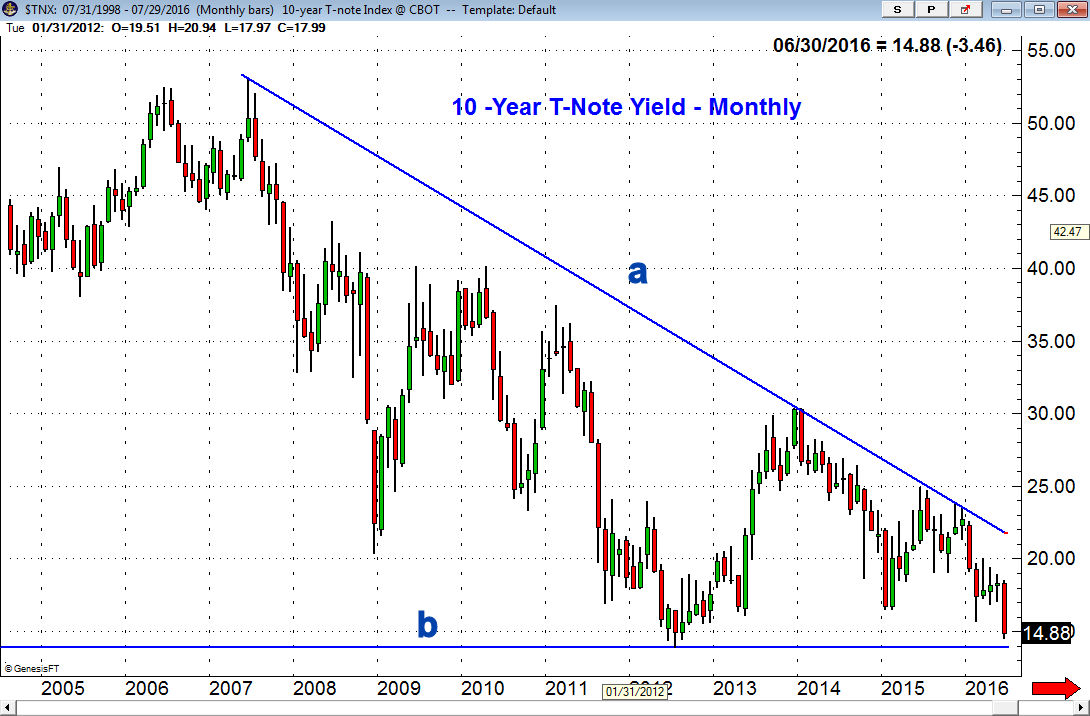
The world is still fixated on the negative bond yields in many parts of the world. The monthly chart of 10 Year T-Note yields shows June's sharp drop in yields with the only remaining support at 1.390% from 2012, line b.
Maybe this is a sign of a deflationary collapse but I am not convinced as it seems as though prices and sentiment maybe reaching an extreme. It would take a monthly close in yields above 2.000% to signal a change in the long-term trend.
Crude oil did manage to close the week higher despite the early drop that held well above the uptrend in the $44 area. The weekly OBV suggests that the pullback may be over. The Herrick Payoff Index, which uses volume and open interest, does not look as strong as it has dropped below its WMA.
The gold futures closed up $16 last week with the weekly starc+ band at $1377. The weekly studies did not make new highs last week but the daily technical studies are positive.
Market Wrap
Solid gains of over 3% in the major averages stemmed the bleeding from the previous week and once again the defensive Dow Utilities led the way up 4.4%. The small cap Russell 2000 lagged as it was up just 2.6%. The market internals were very strong with 2500 advancing stocks and just 653 declining.
There were a number of stocks that actually rose as the market was declining. Last week I Tweeted the charts of both Paychex (PAYX) and CBOE Holdings (CBOE) which were both identified by the relative performance as well as the OBV analysis as good buy candidates.
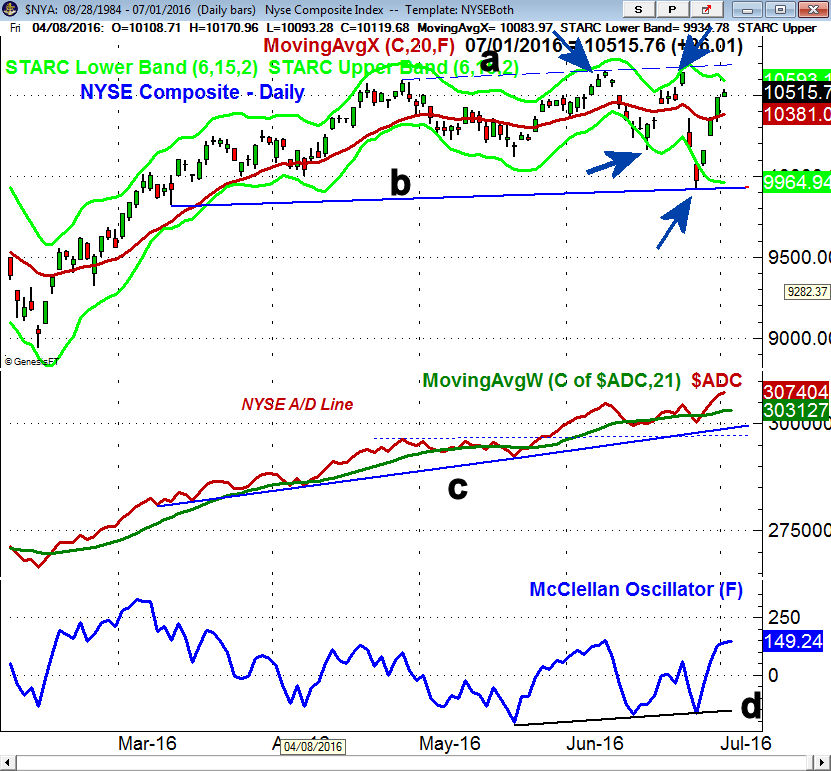
Still the S&P 500 and Dow Industrials are 1% below the pre-vote highs but here has been a clear increase in market volatility that is evident on the daily chart of the NYSE Composite. Since June 8th both daily starc bands have been repeatedly tested (see arrows) which means the risk is high right now in chasing the market. The major averages on Friday did settle below the day's highs.
The 20-day EMA and quarterly pivot for the NYSE are in the 10,350-380 area and I would not be surprised to see a pullback below this support early this week. There is further support in the 10,200 area and then at 10,000. The support in the 9900 area, line b, is now more important.
As I noted earlier the market internals are leading prices higher as the daily NYSE A/D line has now moved well above the June highs. This indicates that the NYSE Composite will eventually move above the resistance at line a with July pivot resistance at 10,785 and then at 11.081. The McClellan oscillator did form a positive divergence at the panic lows, line d, which is consistent with a price low.
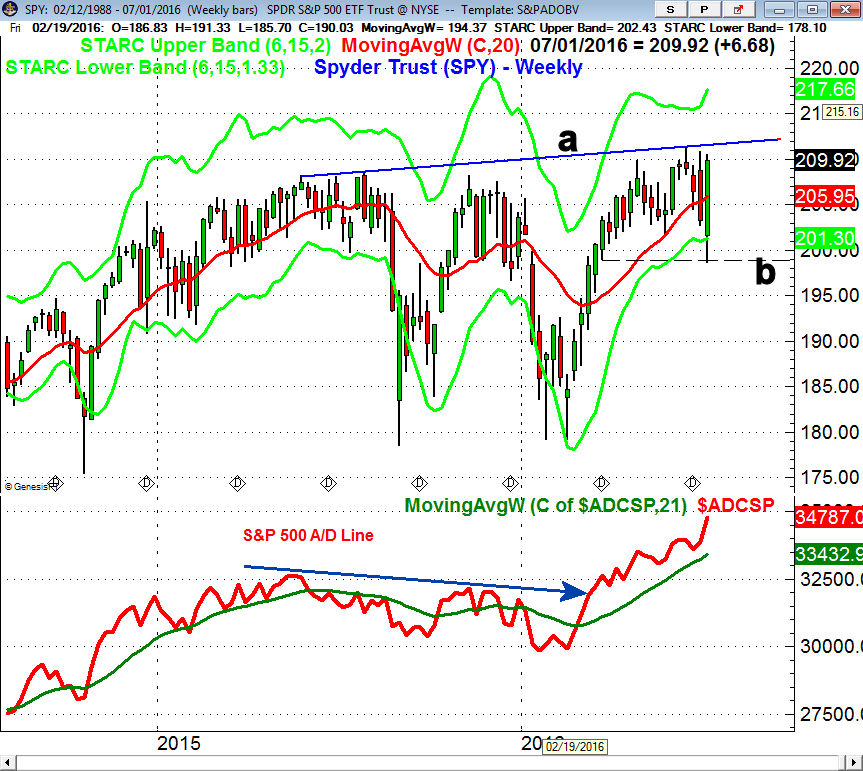
The week's wide range is clear on the chart of the Spyder Trust (SPY) with a low of $198.65 and a high of $210.49. The daily starc+ band is at $211.08 with initial quarterly pivot resistance at $215.11. The 20 day EMA is at $207 with the quarterly pivot at $206.88. There is additional support in the $204.80-$205 area.
The weekly S&P 500 A/D line has accelerated to the upside as the break through resistance, line c, just after the February lows favored the long side for both stock traders and ETF investors. The daily A/D line (not shown) also looks strong which favors buying on a pullback as the next upside target for the SPY is in the $214 area.
The weekly relative performance analysis still favors the SPDR Dow Industrials (DIA) and the iShares Russell 2000 (IWM) over the PowerShares QQQ Trust (QQQ).
What to do? The long weekend is likely to be welcomed by both investors and traders but with the jobs report on Friday there still could be plenty of fireworks in the stock market this week. The sharp increase in market volatility indicates more choppy action that is likely to frustrate both the bulls and the bears.
This could last for a few weeks but I still expect stock prices to be higher by the end of the year.
Longer term investors should continue to favor positions in low cost, broad based ETFs or mutual funds. Many of these ETFs also have very attractive yields that are well above the current yield of the 10 Year T-Note. For example the Vanguard Emerging Market ETF (VWO) has a yield of over 3%, an expense ratio of 0.15% and over 3900 holdings.
Most importantly you should take the time now if you have not already to write down your investment plan and stick with it until there are warnings of a recession or a bear market.
Comments
comments