

The stock market moved sideways for most of last week with the heaviest selling on Wednesday. Finally on Friday we got Janet Yellen's long awaited comments from Jackson Hole where she said "the case for raising rates has strengthened in recent months."
This did little to change the already low expectations for a rate hike in September but then Fed Vice Chairman Stanley Fischer hinted on CNBC that a rate hike was still possible next month. The S&P futures reversed course on his comments as the futures dropped 20 points.
This increases the focus on the September 20-21 FOMC meeting which makes it more likely that it will be tough three weeks for investors and traders. It does not help that we are entering a seasonally weak period where an increase in market noise can play a larger role.
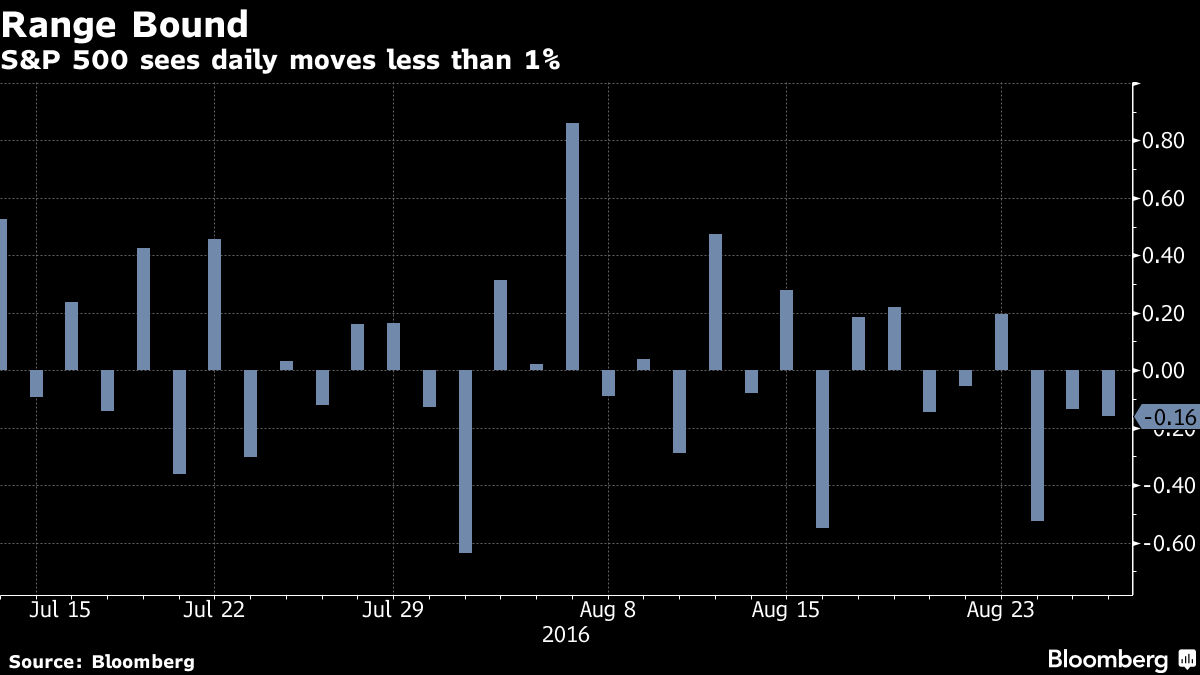
The recent tight ranges and low volume does make the market more vulnerable to wide swings. This low volatility is evident on this Bloomberg chart as there has been only one day with a 0.80% range since mid-July. In the article they commented that "the market is locked in its tightest trading range since the end of 1965." ( I took a look at the chart of the time period and the S&P 500 peaked out early in 1966 and then dropped over 20%)
The volatility is likely to be different in September as on Friday the S&P futures dropped below the lows of the past fourteen days. The stock market rallied Friday afternoon and the Spyder Trust (SPY) closed just barely above the doji low of two weeks ago. Therefore a weekly doji sell signal was not triggered but it could be next week if SPY closes below $217.23. As I discuss in the Market Wrap section the A/D lines have not yet moved into the corrective mode.
Many are wondering if we do get a market correction in the next few weeks how far might the S&P 500 or SPY fall? The fact that the 20-week EMA at $213.32 is still rising strongly is a healthy sign. It does not rule out a drop below the EMA as part of a correction in the major trend. It would take more time and a deeper correction before the SPY could complete a major top. The 20-week EMA is now 1.8% below Friday's close.
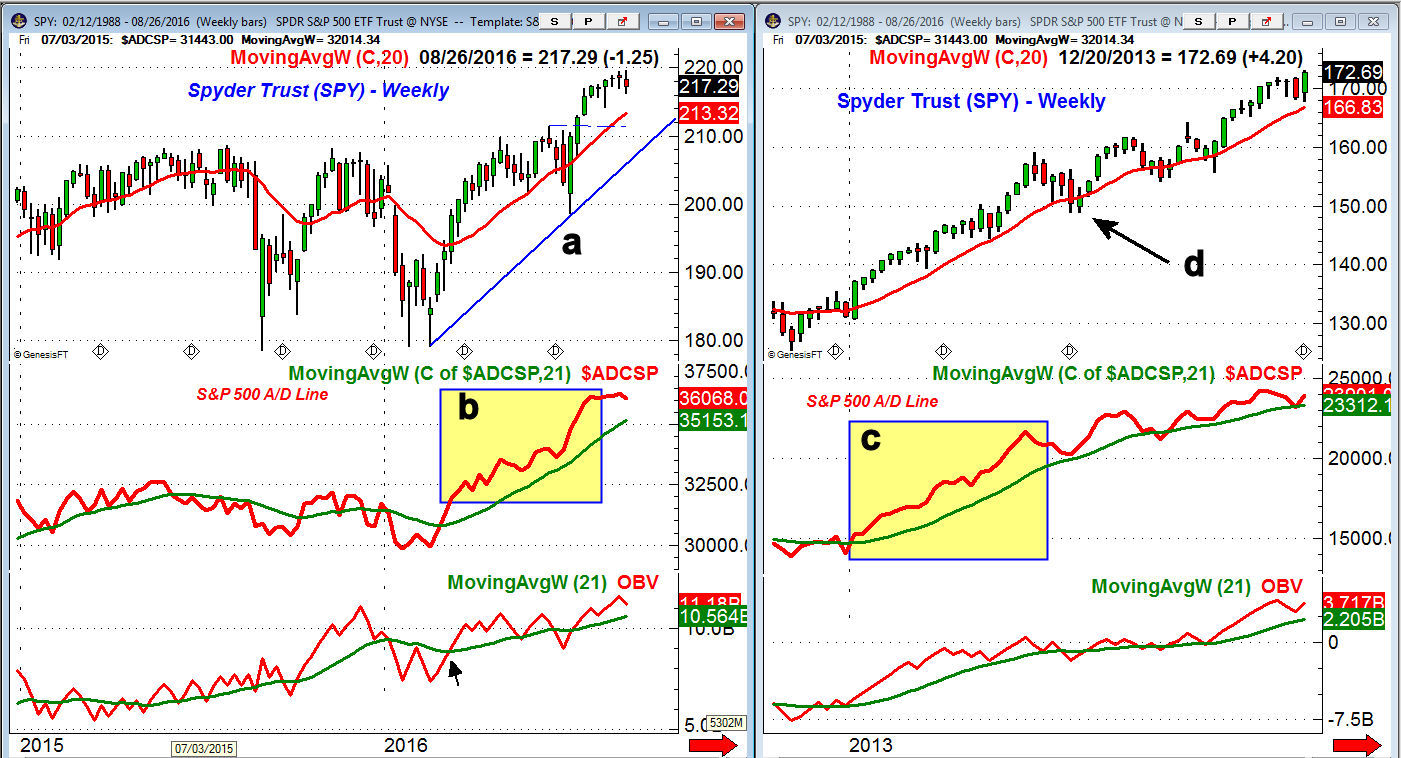
The weekly S&P 500 A/D line has been flattening out after rising strongly since February (section b). It also could correct back to its WMA but it shows no hint yet of topping out. The A/D line is still clearly on the February buy signal. The recent action shows some similarities to early 2013 (chart on right) as there was also a strong six-month rally before there was a meaningful correction. From early January through the middle of June 2013 the SPY stayed above its strongly rising EMA.
In 2013 the SPY corrected for five weeks as it dropped below the 20 week EMA for two weeks before the market again turned higher. The selling in the stock market increased in late June (point d) after Fed Chairman Ben Bernanke commented that the bond-buying program could be stopped by the end of the year. This pullback turned out to be a great buying opportunity.
The weekly A/D line was also very strong in 2013 as it stayed well above its sharply rising WMA (section c). The A/D line turned down the week SPY made its high and over the next five weeks it dropped close to its rising WMA. The weekly OBV did not break down during the correction as it only moved slightly below its WMA. From the high to the low the SPY declined 6.4%.
The SPY currently has weekly support from early June at $211-$212 with further at $209 to $210. A decline equal to what occurred in 2013 would take the SPY to the $205.60-$207 area.
The comments from Fischer and other Fed officials will stimulate more debate next week and in the past few years these periods have often increased the investor uncertainty and have dampened their enthusiasm for stocks. According to AAII individual investors became more cautious last week as the bullish % dropped 6.1% to 29.4% and 29.6% are bearish.
For the past month I have suggested that investors trim the weak stocks , ETFs or funds from their portfolios. This process will be much more difficult if the market does correct further. I would also suggest that investors tune out the financial TV media until after the next FOMC meeting. My concern is that the endless Fed banter will cause some to change their investment plan at just the wrong time.
Maybe I am alone in being irritated with and frustrated by the endless parade of analysts discussing if the FOMC will act or whether they should. There are quite a few traders who seem to have a strong opinion that the Fed should raise rates now. Apparently they think they know what is best for the economy even though many real economists are not that sure.
There are also quite a few elected representatives who want the Federal Reserve to follow set rules in the future. Anyone who studies the economic history going back to the early 1900's realizes that no two recessions are really the same. One cannot recover from a recession by following set rules and clearly the severity of the last recession caused more structural damage than any economic downturn since the Great Recession. It is not surprising that Janet Yellen is now considering a change in the Fed's inflation guidelines.
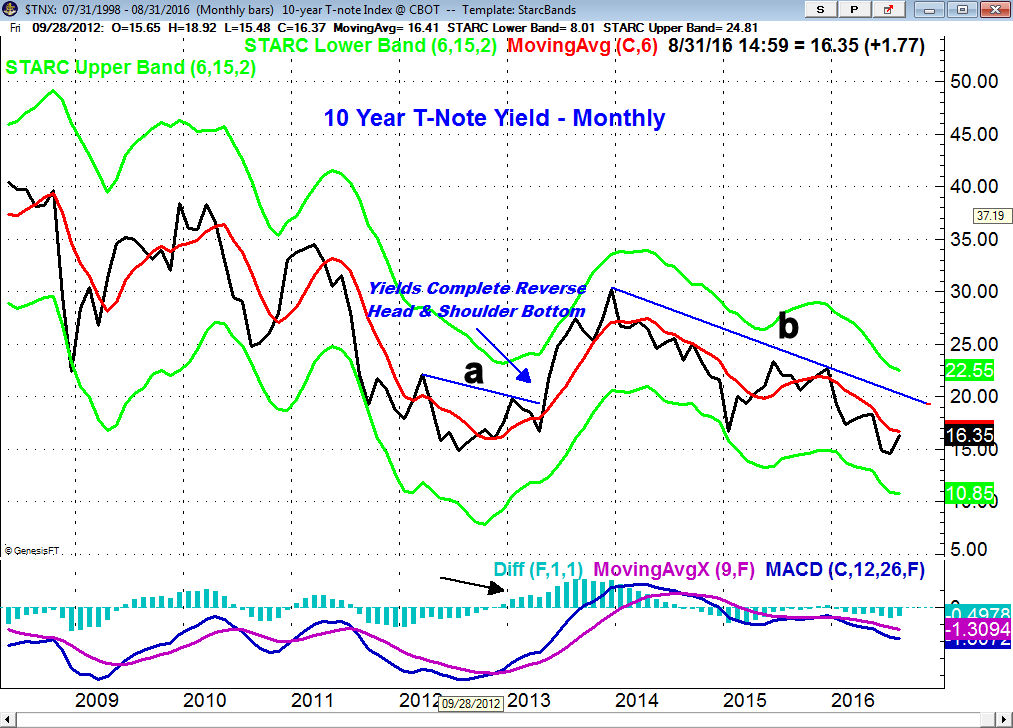
Last week I discussed the feared bond market bubble where I stressed my view that if interest rates do turn higher there should be plenty of warning from the technical studies. Though the month is not over yet it does seem as though rates will close higher in August. As I noted last week the weekly MACD is positive but the monthly MACD still looks weak. The monthly downtrend, line b, is well above the market at 2.00%, line a.
The yield on the 10 Year Yield note rose from 2.00% to 3.00% between May and December of 2013 2013. This turn was signaled technically at the end of May as the weekly yield chart completed a reverse head and shoulders bottom formation by moving through resistance at line a. The positive MACD in 2013 was in agreement with the weekly analysis.
Through the daily and weekly monitoring of the bond market and the key ETFs there should be clear evidence when the bond market turns the corner.
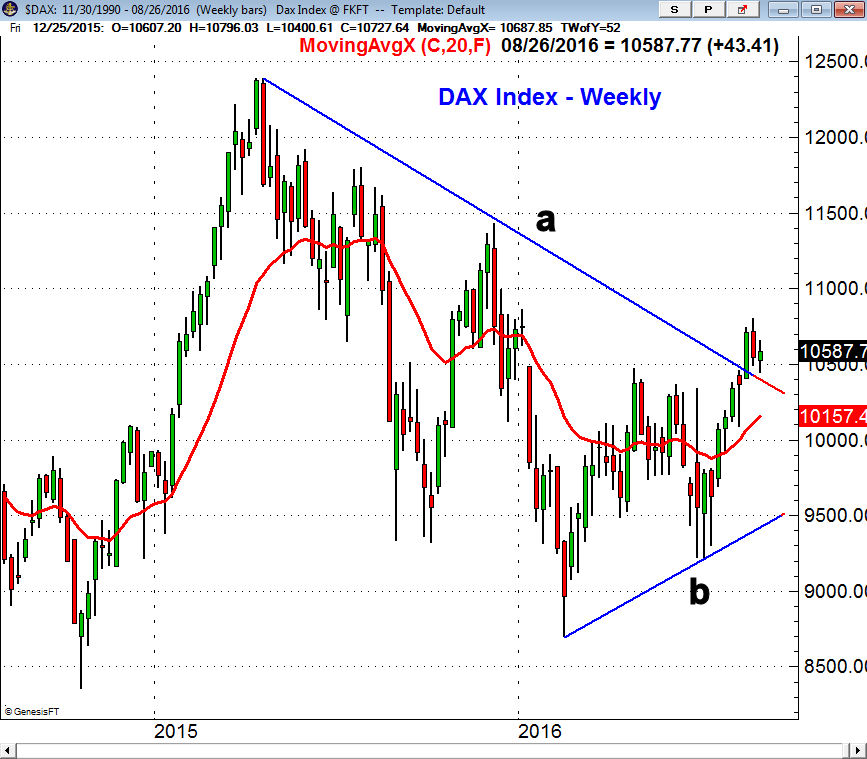
The technical outlook for the Dax Index has improved over the past few weeks as the downtrend from the 2015 highs, line a, has been decisively broken. This was consistent with improving economic data from the Euro zone countries. This suggests that if these markets do correct with the US market the Dax could pull back to the 20 week EMA in the 10,000 area which may create a good buying opportunity.
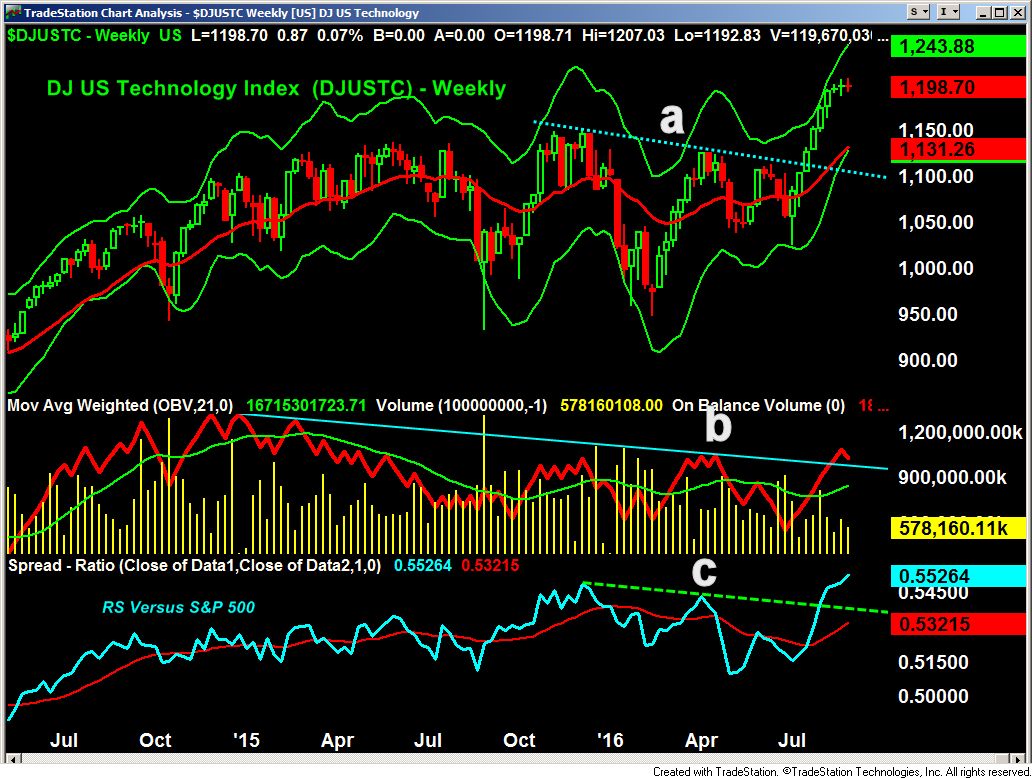
The expected market correction should create some good opportunities in both the index tracking ETFs as well as some of the key sectors. The weekly chart of the DJ US Technology Index looks especially interesting. The recent weekly dojis near the weekly starc+ bands does favor a pullback over the near term. However it is more important that the major resistance at line a, was overcome in July. It is now important support.
The breakout was confirmed by a move in the on-balance-volume (OBV) through the long-term downtrend, line b. The relative performance has also completed its weekly bottom formation as the resistance at line c was overcome. For Viper ETF investors and traders this should create some new buying opportunities.
Over the past few weeks my scans of the Nasdaq 100 and IBD top 50 stocks have revealed a majority of new sell signals. Subscribers of the Viper Hot Stocks Report are now holding a majority of short positions but a correction should create some excellent buying opportunities in those stocks which have become the new market leaders.
The Economy
Last week's Chicago Fed National Activity Index was stronger than expected while the Richmond Fed Manufacturing Index was weaker. The manufacturing sector continues to be a concern as the flash reading on the PMI Manufacturing at 52.1 was a bit weaker than expected. The focus this week will be on Wednesday's Chicago PMI as well as Thursday's ISM and PMI Manufacturing indices.
New Home Sales were very strong last week but due to low inventories the Existing Home Sales were down. This week we get the S&P Case-Shiller Housing Price Index on Tuesday and the Pending Home Sales Index on Wednesday.
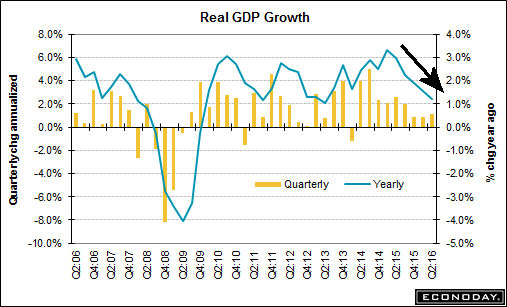
Last week's Durable goods report showed a healthy 4.4% increase but the preliminary reading on 2nd quarter GDP came in at 1.1% which was weaker than the advance reading. The chart of GDP does show a concerning downward trend in the yearly data while some of the Feds own models forecast a more healthy GDP in the 3rd quarter. Consumer Sentiment at 89.8 was weaker than the expected 90.7 but the internal numbers did reflect optimism over the job outlook.
As this week progresses the focus will be on Friday's jobs report as economist speculate that an increase of 200,00 jobs or more will increase the odds of a rate hike by the Fed.
Interest Rates & Commodities
Crude oil rebounded on Friday but still closed the week lower. In Friday's technical review of the crude oil market "Another Wrong-Way Crude Oil Trade" I demonstrated how technical analysis, unlike the fundamentals, can give you a unique perspective on crude oil.
The careful monitoring of the open interest (the number of futures contract outstanding) through the Herrick Payoff Index can help you determine when you should be buying or selling. The daily studies from Friday's article did improve with Friday's higher close.
The gold miners were hit hard last week as the gold futures dropped $20. This makes a further decline likely but the gold miners are likely to drop further with next good support for GDX in the $24 area.
Market Wrap
The Dow Utilities and Transports led the market lower last week as they dropped 2.4% and 1.3% respectively. The S&P 500 lost just under 0.70% while the small cap Russell 2000 was up slightly for the week. There were 1413 stocks advancing and 1701 declining with about the same number of new weekly highs as the prior week.
Only the financial stocks were higher last week as they managed a 0.38% gain while the technology and industrial stocks were a bit lower. Consumer goods were down 0.63% while the consumer services lost 1.18%. The furor over Mylan and the cost of their EpiPens hit the health care stocks as they were down 1.58%.
In an interesting Barron's article Mark Hulbert pointed out that Hulbert Nasdaq Newsletter Sentiment Index stands at 80.6% and he commented that it was "higher than the highest level to which the HNNSI rose at the tops of the last four bull markets."
After the market dropped on the Brexit vote it hit a low of -55.56% which turned out to be an excellent buying opportunity. I think a 2-3% drop in the Nasdaq would lower these numbers significantly.
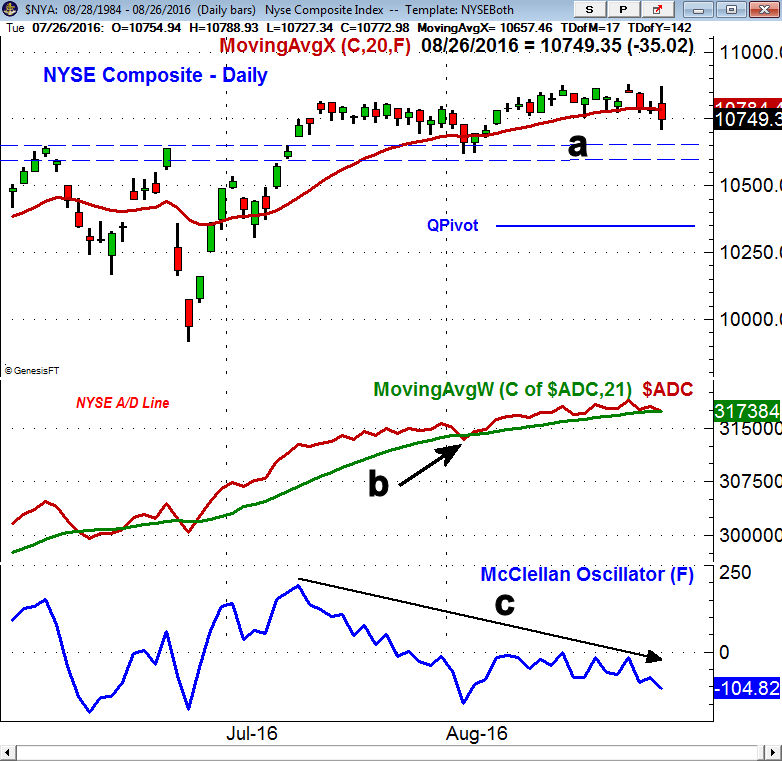
The daily chart of the NYSE composite shows the wider range on Friday but it is still above the support, line a, in the 10,600-700 area. A break below this level could signal a decline to the quarterly pivot in the 10,350 area. A strong close above 10,900 is needed to return the focus on the upside.
The NYSE A/D line has dropped back to its still rising WMA but is still above it. A decisive break is needed to suggest a deeper correction with more important support at the August low, line b. The McClellan oscillator has been declining since mid-July and is already slightly oversold at -104.
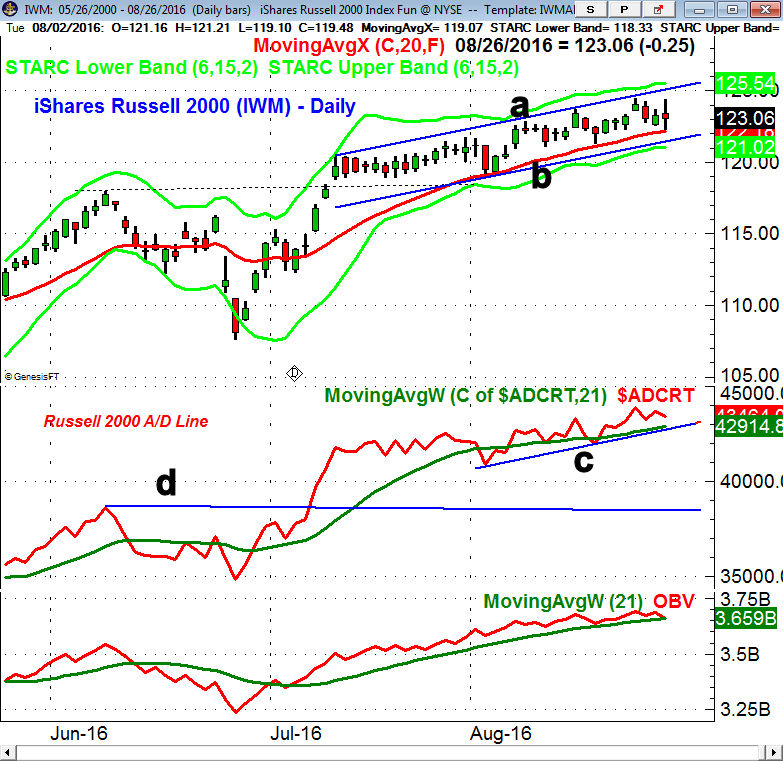
One of the bright spots is the iShares Russell 2000 (IWM) as it bounced from the 20 day EMA on Friday. It is still in the upward sloping trading channel, lines a and b. The daily starc+ band and near term resistance is in the $125-$126 area.
There is good support initially in the $121 area with further at $119 which was the August low. The Russell 2000 A/D line made a new high early last week as it is still well above its rising WMA and the support at line c. The A/D line has additional support at the August low with major at line c. The OBV is testing its WMA but is still barely positive.
The daily relative performance analysis indicates that the IWM and the PowerShares QQQ Trust (QQQ) are both acting stronger than the S&P 500. The QQQ has first strong support in the $114 area which if broken could signal a drop to the $110-$111 area.
What to do? The increase in the market's ranges last week may be warning of a further decline but the A/D lines have not moved into the corrective mode. Still the market risk seems high given the low volatility, concerns over a possible rate hike and a job report on Friday.
I continue to recommend that investors actively look at their portfolio to see if they have any weak holdings. If the market does start to correct those weak holdings are likely to decline more than the overall market.
For investors since a 5% decline is possible in the SPY you will need to decide whether you want to ride out a correction or sell on strength and look to re-buy lower. Though September could be a rough month there is likely to be a great buying opportunity for a stock market rally into early 2017 as there are no signs of a recession.
If you like Tom’s analysis and want specific entry/exit advice on ETFs you might consider the Viper ETF Report which is just $34.95 per month and can be cancelled at any time..
Comments
comments