

The stock market recorded another solid month of gains in October with the S&P 500 up 2.2%. Many investors may be even more bullish now because of the historically strong performance of the stock market in November. Since 1950 the S&P 500 has had an average gain of 1.38% in November as it has been up 44 times and down just 23 years.
The Dow Industrials did even better in October as it was up an impressive 4.3%. This was the largest out performance over the S&P 500 since November 2008. As I pointed in last week’s article the Dow’s October close above its monthly starc+ band was the first time since May 2007.
It was a great month for most of the major market tracking ETFs as the Powershares QQQ Trust (QQQ) was up 4.61% as it was up almost twice as much as the Spyder Trust (SPY) which gained 2.36%. The small cap iShares Russell 2000 (IWM) was up only 0.73%.
The strong 4.43% gain in the SPDR Dow Industrials (DIA) can be attributed to its projected 6.3% earnings growth this quarter. If this holds it would be the third consecutive quarter where it had higher earnings growth than the S&P 500.
The S&P 500 was only down fractionally in November 2015 (-0.02%) and had similar monthly losses in 2011 (-0.32%) and in 2010 (-0.44%). The last large decline was in 2008 when the S&P 500 was down 7.48%. That followed a 16.79% decline in October which was in the middle of the bear market.
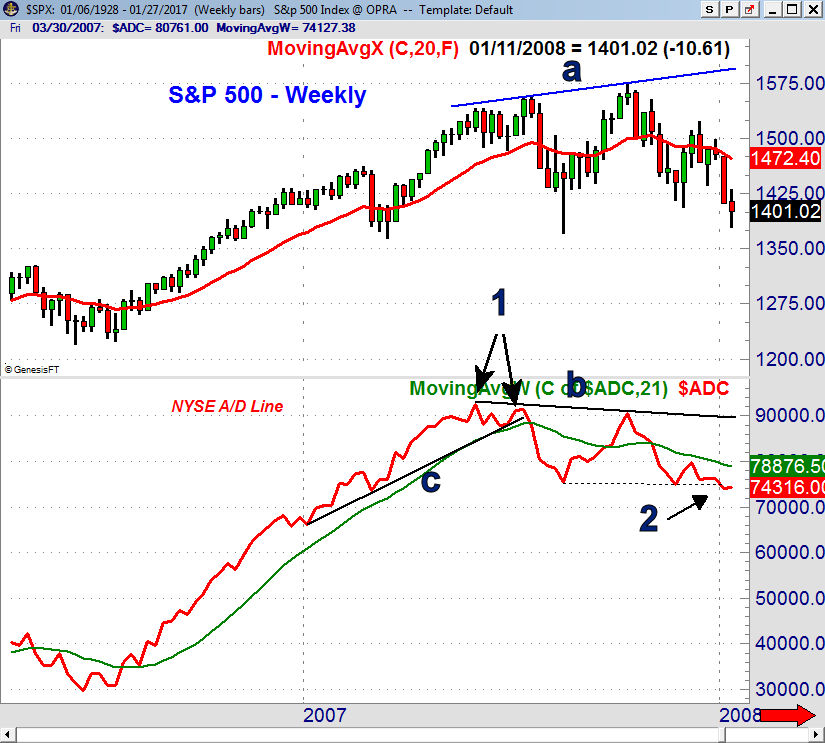
The S&P 500 was down 4.18% in November 2007 which ended the rally from the August 2007 low as the major averages made intra-day highs on October 11th 2007. As I have noted in previous posts the advance/decline lines peaked in June 2007 and then formed a lower high in both July and October (see chart). These divergences indicated the bull market was ending.


The daily chart of the NYSE Composite shows that the NYSE Advance/Decline line had entered the corrective mode on July 19th 2007 (point 1) as it had rallied back to the flattening WMA and then turned lower. By the end of August the A/D line was bottoming out and by the middle of September it was in a solid uptrend, line a.
The NYSE Composite had a high of 10,387 on October 11th and just five days later the A/D line dropped back below its WMA. One day later the support in the A/D line, point 2, was also broken. From the October 22nd low at 9824 the NYSE rallied just over 5% in seven days. The October 31st close at 10,311 was the highest of the bull market.
The NYSE A/D line was acting weaker as it just rallied back to the declining WMA on October 31st (point 3) which completed the top formation. The next day the NYSE dropped 3% and the Dow lost 367 points. By the January 2008 low the Dow Industrials had lost over 2000 points.


The S&P 500 was down 8.01% in November 2000 which followed a minor loss of 0.58% in October of 2000. The support in the NYSE A/D line, line a, had been broken on September 18th (point 1) which was one day after it violated its WMA. From the September high to the October 18th low the NYSE dropped over 10%.
The NYSE then staged an impressive rally of 8.9% to close the month at 7042 as the month’s losses had been erased. The NYSE A/D line moved back above its WMA on October 30th, point 2. Just nine days later the A/D line reversed as it had dropped back below its WMA, point 3. The A/D line did not turn positive until the end of the year.

As of the close on Tuesday October 31st the NYSE Composite was down just 0.8% from its high as it closed just above its 20 day EMA. The NYSE A/D line completed its correction on August 25th, line 1, as it had moved above its downtrend (line a) and its WMA. It bottomed ahead of the other A/D lines and I feel it is important to also monitor the S&P 500, Nasdaq 100, Dow Industrials and Russell 2000 A/D lines in order to get a true picture of the market’s trend.
The NYSE A/D line dropped below its WMA on October 25th (line 2). It turned up on Tuesday but is still barely below its WMA but that could change with a positive close on Wednesday November 1st. A close in the NYSE A/D line below the October would be a sign of weakness.
Clearly the rest of the week may be volatile as we are expecting to learn the name of the new Fed Chair and also get the release of the long awaited tax plan. Then Apple Inc. (AAPL) releases its earnings after the close on Thursday and we have the monthly jobs report on Friday. If there is a day of very negative A/D numbers it could shift the A/D lines into the corrective mode.
In my Viper ETF Report and the Viper Hot Stocks Report, I share my A/D analysis twice each week and give specific buy and sell advice. Each service is only $34.95 per month and can be cancelled on line.
Comments
comments