

May 16, 2021: Over the past month, it seems like investors have simply been ignoring rising inflation, but on Wednesday, that seemed to change. The market’s vulnerability surfaced on Monday, when the S&P 500 tried to move higher but then closed down 1%. The Nasdaq composite was down 2.6%, as Facebook Inc.FB (FB) dropped 4.1% while Tesla (TSLA) lost 6.4%
The stock market was hit with even more selling on Tuesday as the Dow Jones Industrials closed down 680 points (2%), while the Nasdaq Composite was down 2.7%, which put it down 5% in just two days. As Wednesday’s Consumer Price Index report came in worse than expected, the selling became heavier as there were signs of panic liquidation.

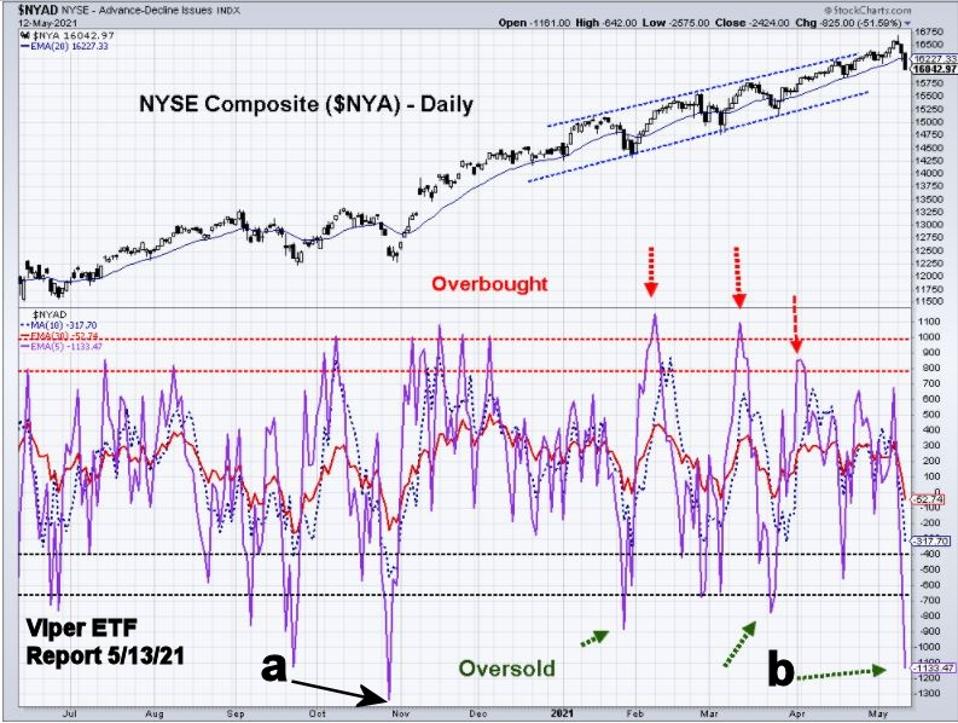
By Wednesday’s close there were a number of signs that the market was sold out. The chart above shows daily data for the NYSE Composite and the NYSE Advance-Decline Oscillator (A-D Osc). Unlike the Advance/Decline line, which adds the difference between the advancing and declining stocks to a sum over time, the A-D Osc shows the net number of issues in a market that advanced or declined each period (usually daily). Very high values indicate the market is generally overbought, and low values indicate that the market is generally oversold.
The 5-day exponential moving average (EMA) reached -1133 (point b) after the close on May 12th. This was its lowest level since late October 2021 (point a). The stage was therefore set for the sharp rally that lasted until Friday’s close.

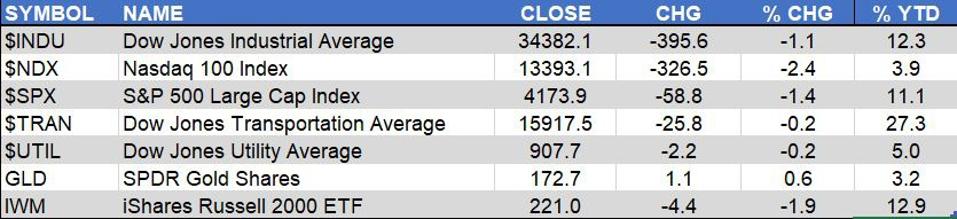
With the oversold rebound at the end of the week, the weekly results were not that bad. The Dow Jones Transportation Average and Dow Jones Utility Average were both only down 0.2%, while the SPDR Gold Shares were up 0.6%.
The Nasdaq 100 Index was the weakest, down 2.4% for the week, but 3.3% above the week’s low. It is now only up 3.9% year-to-date (YTD). The Dow Jones Transportation Average, which has more value stocks, is up 27.3%. Both the S&P 500 and Dow Jones Industrial Average are still up double-digits for the year.
On the NYSE last week there were 997 issues advancing and 2496 declining. It was no surprise that the numbers were more negative on the Nasdaq Composite, which had 1294 advancing and 3152 declining issues. Despite the negative numbers, all of the weekly advance/decline lines are still positive, closing above their weighted moving averages (WMA).

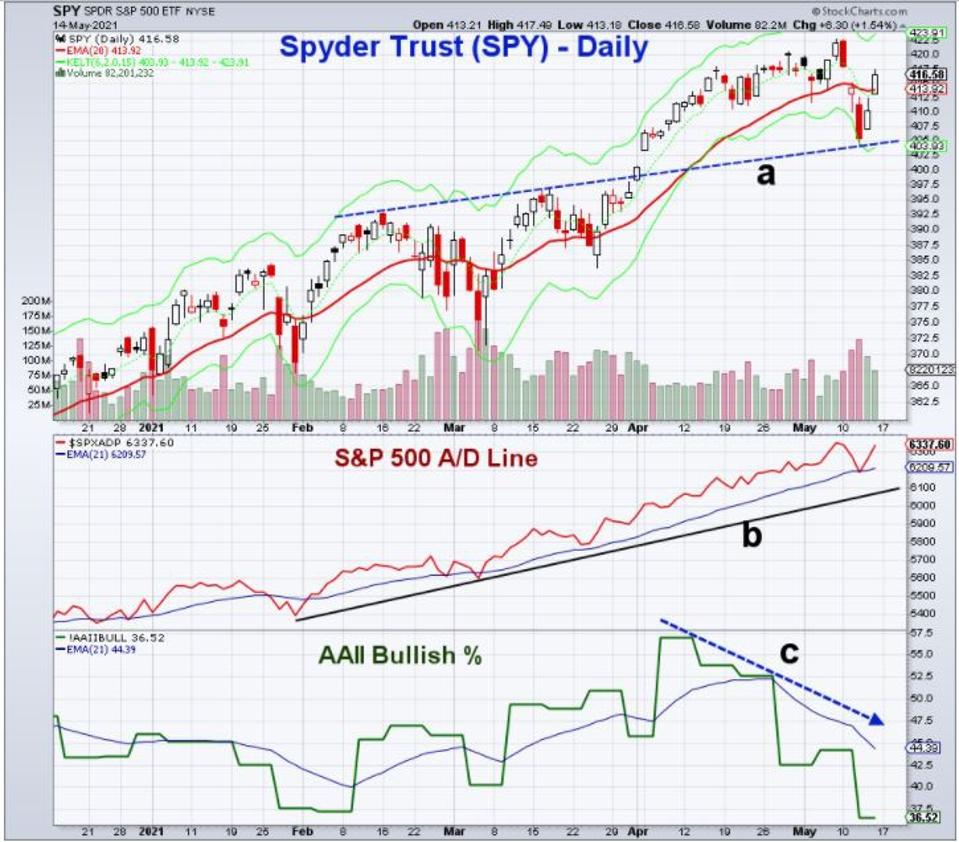
The daily analysis of the Spyder Trust (SPY)SPY does provide evidence that the correction could be over. On Wednesday, the SPY dropped down to test the breakout level from the February-March trading range (line a). The daily starc- band was also reached, while Wednesday’s low at $404 was close to the monthly pivot support at $403.41.
The S&P 500 Advance/Decline line had made new highs on May 7 but then dropped back to its EMA last week before turning higher. There is stronger A/D line support going back to February (line b). The sentiment in the American Association of Individual Investors survey has also changed since early April. The Bullish % peaked on April 7 at 56.9%. It has since formed a pattern of lower highs (line c), and last week was at 36.5%.
So do dip buyers need a strategy? Definitely, as in my view one should generally only look to buy corrections in those markets that are in a strong uptrend. Of course, the buy levels need to be determined by the data as well as careful risk analysis, not by emotion. Many critiques of dip buying do not factor in the guidelines I would suggest.

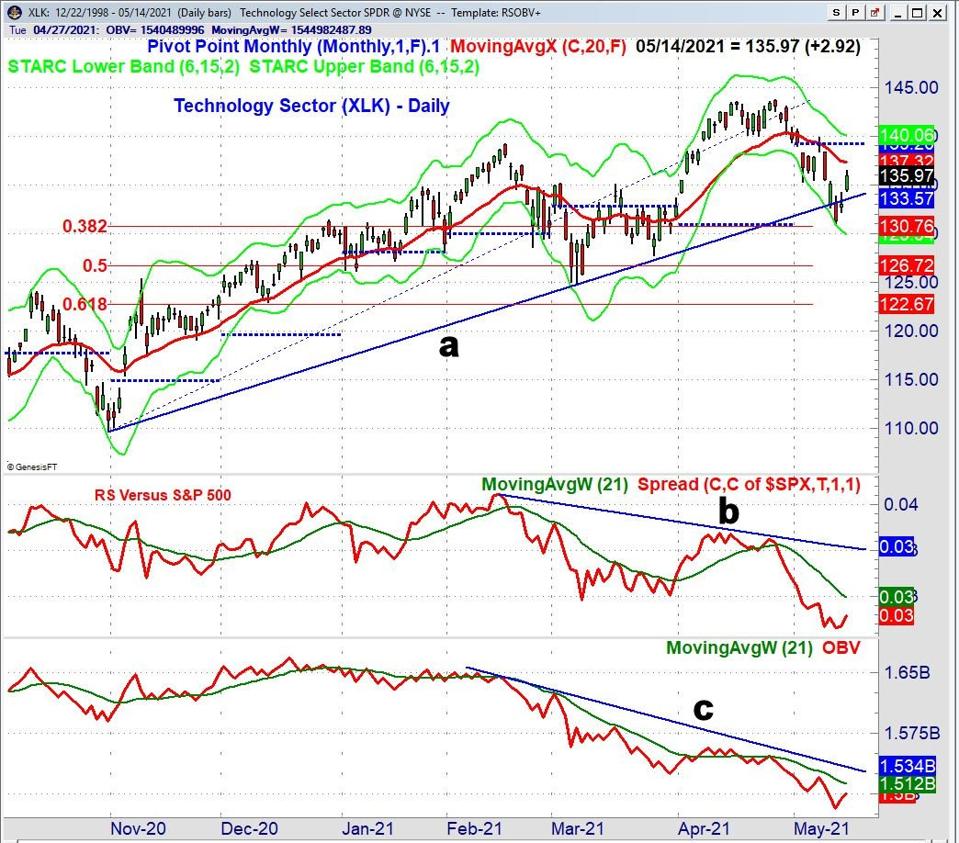
The Technology Sector (XLK)XLK is up just 3.8% YTD, peaking at $143.77 on April 27. It had a low of $130.96 on Wednesday which was below the daily starc- band. The daily uptrend (line a) was broken. XLK closed Friday at $135.97, with the declining 20-day EMA at $137.32 and the monthly pivot level at $139.20. The 38.2% Fibonacci retracement support at $130.76 from the October 30 low was almost reached. If that level is violated, then the next target is the 50% support at $126.73.
The relative performance versus the S&P 500 (RS) did not make a new high with prices in April, forming a negative divergence (line b). This was a sign that XLK was no longer leading the S&P 500. The RS has made lower lows and is still well below it declining WMA. Therefore, despite last week's rebound rally, it is no longer a market leader.
The on balance volume (OBV) measures whether the volume is supporting the price action or not. The OBV peaked in February and formed lower highs in March and April diverging from prices over the last three months (line c), which is a sign of weakness. If the OBV moves above its WMA and the downtrend, this might indicate that a bottom is being formed.

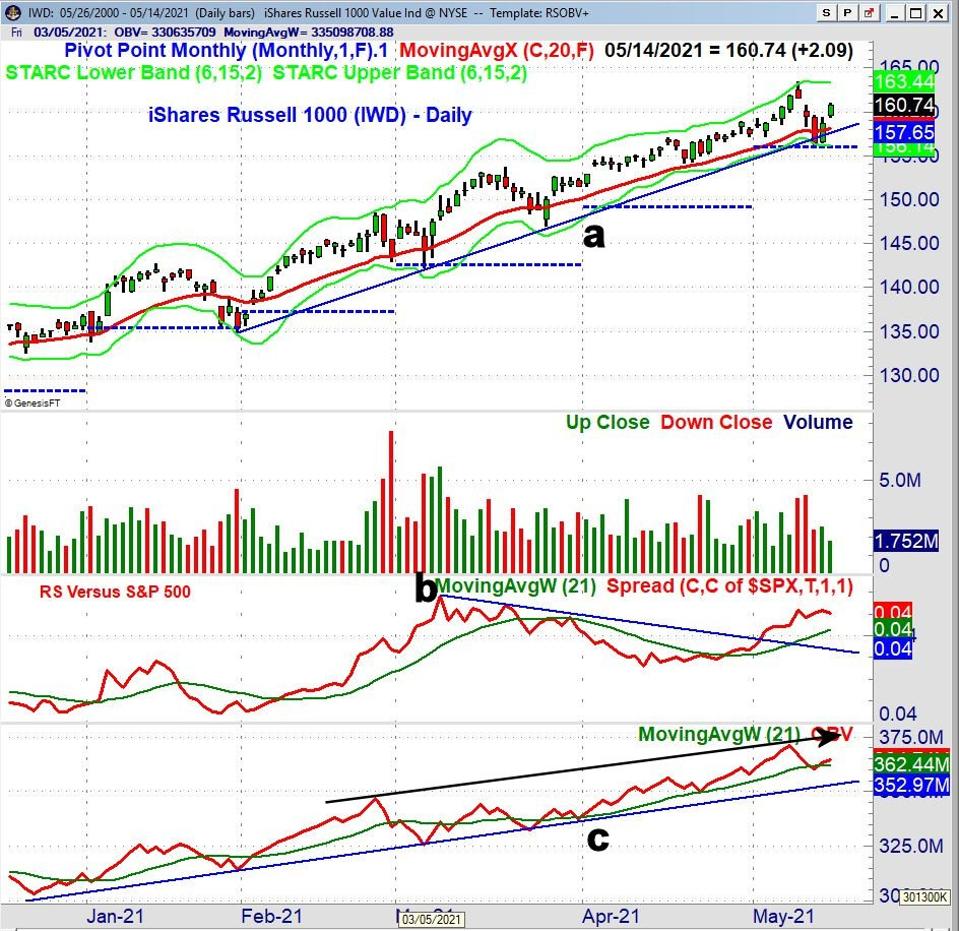
The iShares Russell 1000 IWD (IWD)IWD was down 0.60% last week, but is up 18% year to date as it concentrates on large-cap U.S. value stocks. The daily support (line a) and the monthly pivot at $155.99 were approached last week as the low was $156.26. The monthly R2 resistance is at $163.34, with the weekly starc+ band at $166.33. A close above the all-time high at $163.39 is needed to confirm that the correction is over.
The daily RS is above its WMA and rising after breaking its downtrend (line b) at the start of May. It is still below the March highs and has not yet made a new high. The OBV did make a new high on May 7, but its WMA was briefly violated last week. The OBV is positive and well above the support (line c).
In looking at individual stocks, one should try to identify a similar pattern. Once a stock is extended on the upside (near its starc+ band), find a support level from a prior high, moving average or pivot analysis in order to identify a potential buy level. A second stronger level of support below this buy level should also be identified to use as a protective stop level, in case heavier selling develops. Risk management is critical, and this method is one way to manage your risks. I discussed JPMorgan Chase (JPM) last week, and discuss it again below, using this approach.

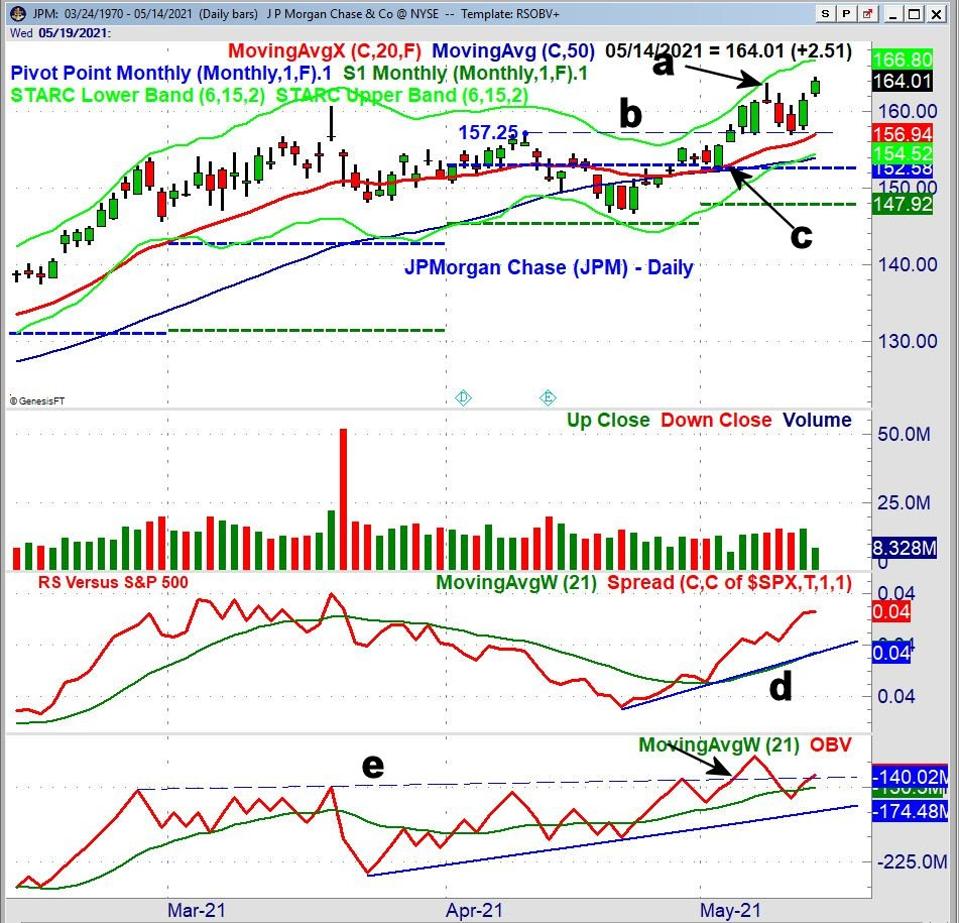
JPM had a high on Monday of $163.73 (point a), which was above the daily starc+ band, putting JPM in a high-risk buy area. The April high at $157.25 (line b) was first support. After Monday’s close, the rising 20-day EMA was at $155.12. The May 4 low of $152.14 (point c) was more important support, and the monthly pivot was at $152.58.
The daily technical studies were positive with last Monday’s close, as the RS had bottomed at the start of May and had moved above its WMA to form a short term uptrend (line d). The daily OBV had overcome resistance going back to late February (line e) on May 6, leading prices higher. JPM had a low Wednesday at $157.03 but closed Friday at $164.01 as the OBV moved back above its WMA.
Clearly this type of approach is not suited to every trader, and may not be the best approach for you. However, if you follow technical analysis and employ good risk management techniques, guidelines like these can increase your probability of success.
Staying away from stocks in technical downtrends is also crucial. Buying the pullback in XLK last week may be working so far, but technically XLK is still in a downtrend, and this approach is unlikely to work for long.
The rebound in the growth stocks and ETFs last week can go further, but I continue to favor value stocks and sectors, as some may be ready to breakout to the upside.
In the Viper ETF Report and Viper Hot Stocks Report, I update subscribers with my market analysis at least twice each week and provide specific buy and sell advice. Each report is just $34.95 per month. New subscribers also receive six free trading lessons, a $49 value.
Comments
comments