
-
The further turmoil in the Trump administration and growing controversy in Washington did not stop the stock market from moving even higher last week. The surge in stock prices over the past two weeks surprisingly has not been accompanied by an increase in the bullishness of the individual investor.
According to AAII the bullish % dropped 2.7% to 33.1% while the bearish % rose 4.7% to 32.4%. if the bearish % rises again this week it would be even more surprising. It seems like the horde of bearish analysts that were bombarding my inbox in January have moved to the sidelines.
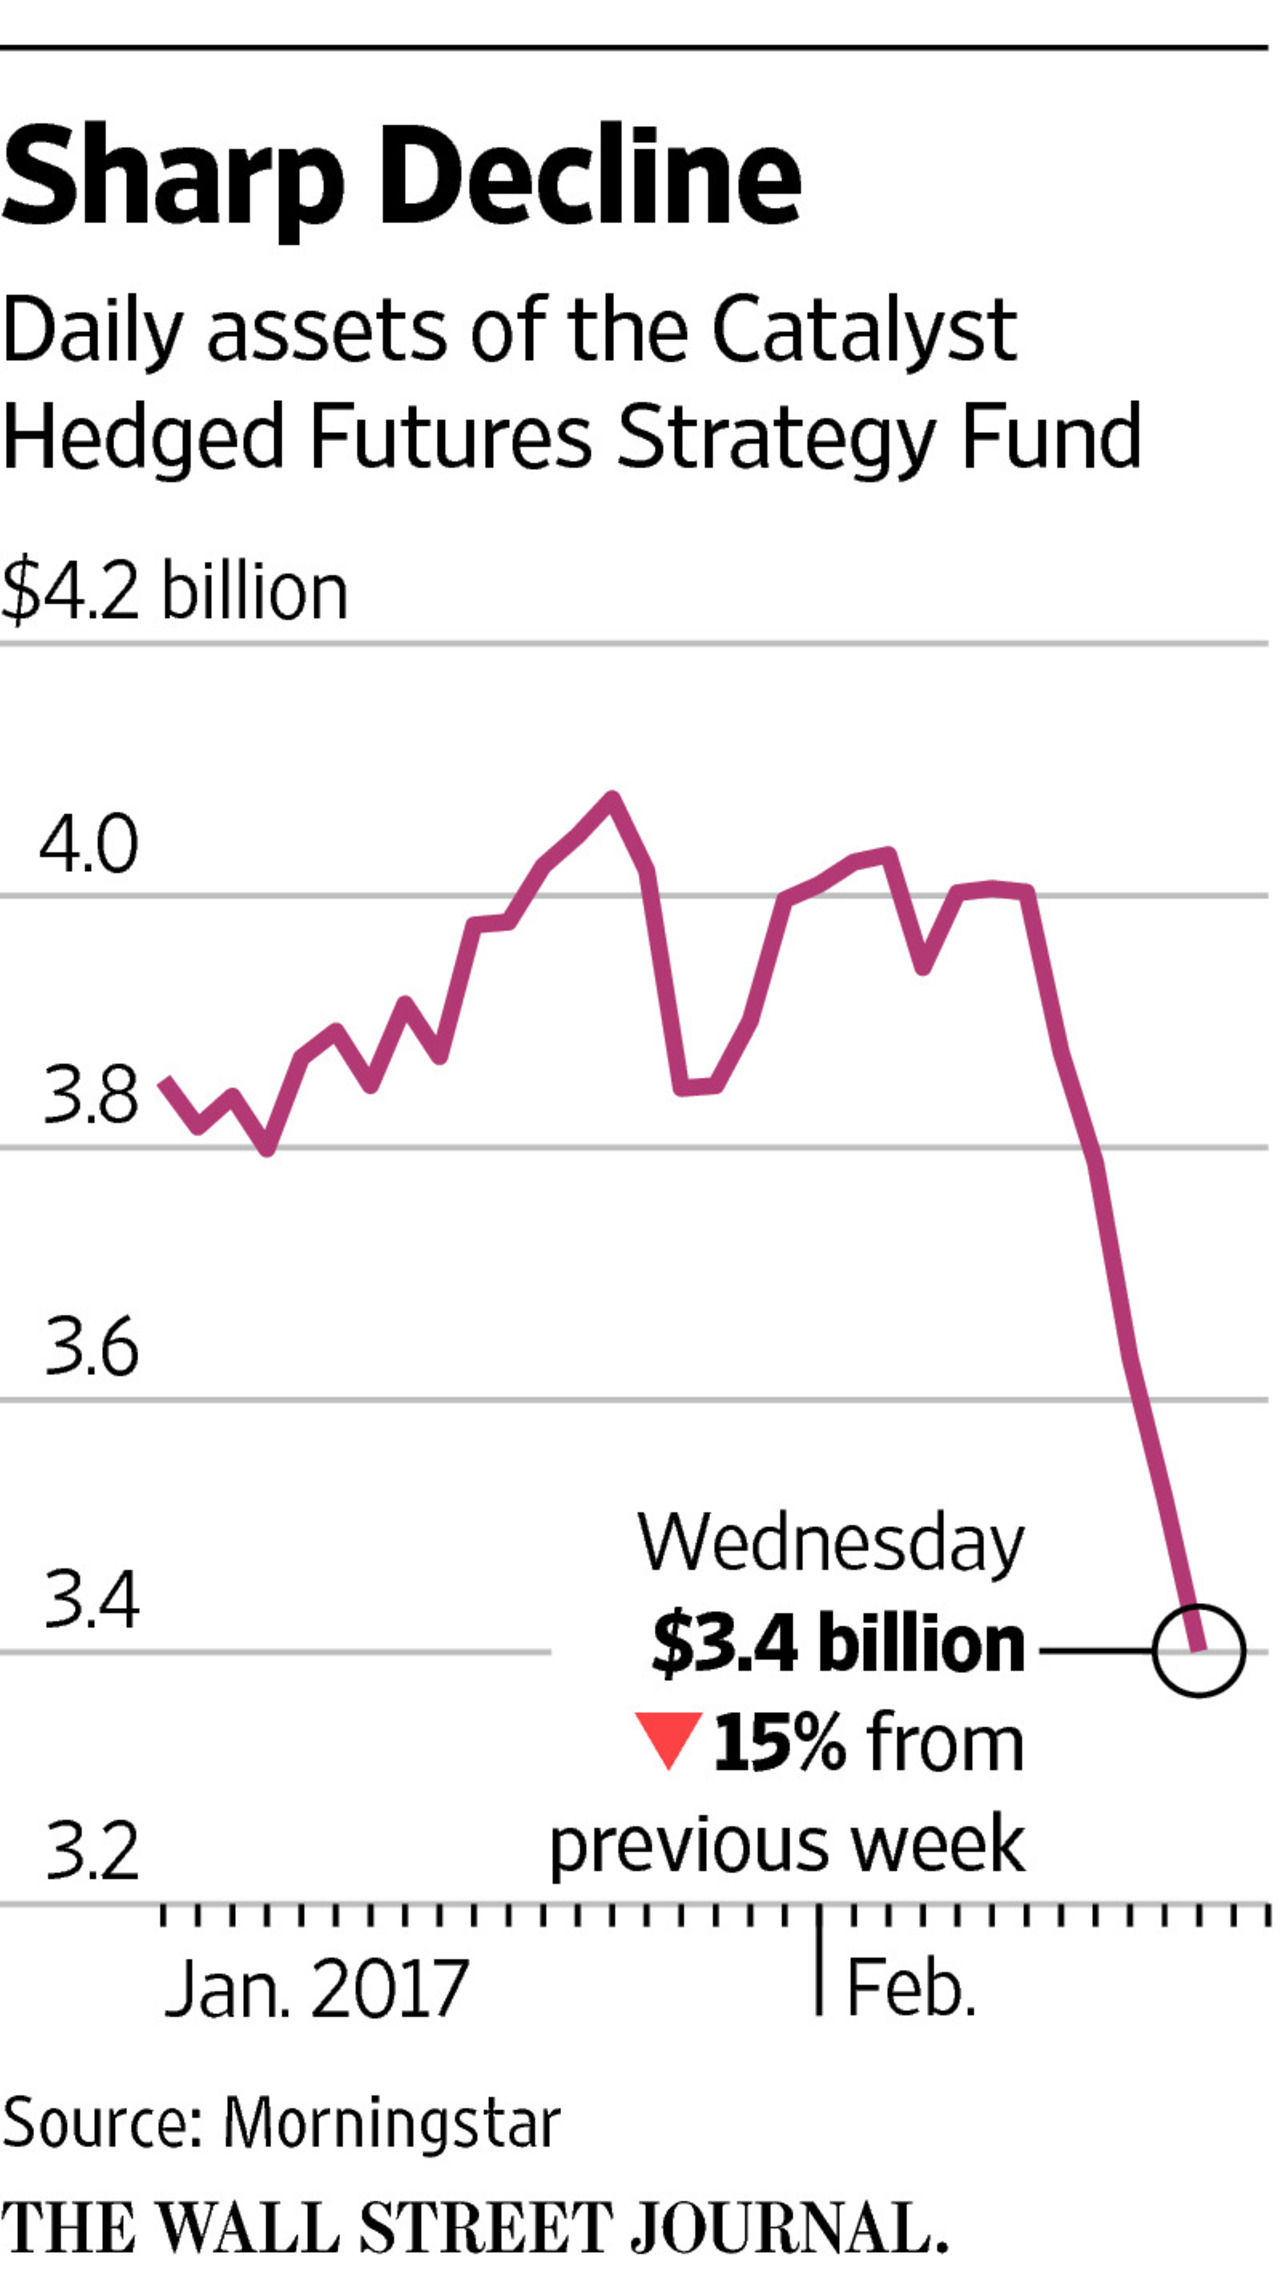
The stock market strength is causing some pain as the Catalyst Hedged Futures Strategy Fund lost $600 million or 15% in just five days as reported by the Wall Street Journal. The loss was tied to an option strategy that benefits from a stable market. The bearish part of this strategy moved further under water as the market again pushed to the upside and the decision was made to limit the losses. According to Morningstar the fund has done 2% better per year than the S&P over the past nine years.
After closing a new records for six days in a row the Dow Industrials sagged early Friday but rallied late to again close higher. The rally over the past week was confirmed by the technical studies as discussed in the Market Warp section but though the market internals were positive they were not that impressive.
What was impressive was the economic data as it indicates that the economy continues to improve. One portfolio manager on the credit side commented that "the real risk... is that the economy runs too hot." Those who have been pessimistic on the economy for the past few years must be shaking their heads in disbelief.
Typically January is not one of the best months as since 1950 the S&P 500 has averaged a gain of 0.79% so last month's 1.79% gain was the best since the 5% gain in 2013. Of course 2013 was the best year of the bull market as the Spyder Trust (SPY) gained 32.3%.
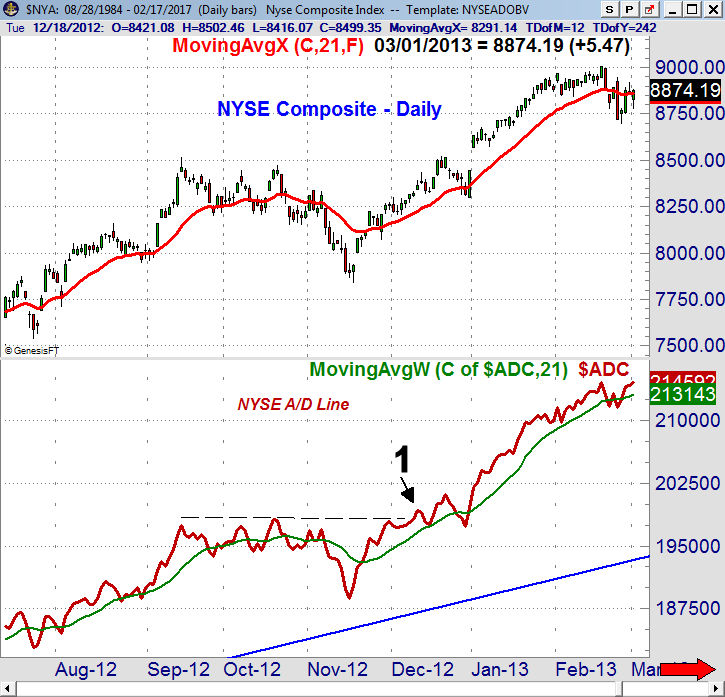
This banner year was preceded by a strong move in the NYSE A/D line in December 2012 as it moved to a new all time high on December 12th (point 1) though the NYSE Composite was still 1.5% below its high. The A/D line made another new high before stocks plunged into yearend over fears of the impasse over the "fiscal cliff". The analysis of the A/D had me recommending before the drop that investors "Stuff Those Stockings with Stocks".
The long-term performance of the S&P 500 in February shows a loss of 0.05% with the S&P up 38 years and down 29 years. In 2013 the S&P 500 was up 1.1% and is currently up 2.9% but of course the month is not over.
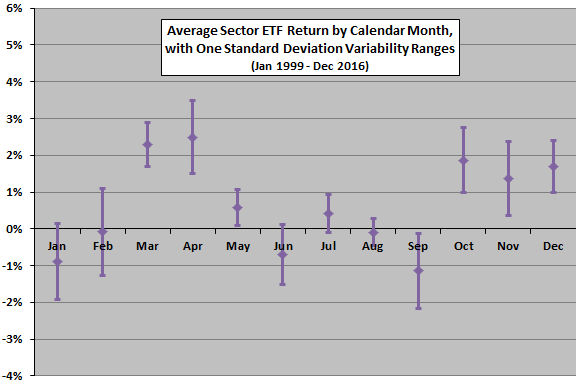
When it comes to the Spyder Sector ETFs two of the best months are March and April as this chart from CXO Advisory indicates. Their analysis reveals that the energy (XLE) , financial (XLF), materials (XLB) and consumer discretionary (XLY) have gained between 5-6% in March and April. Let's look at each of these sectors and their related markets.
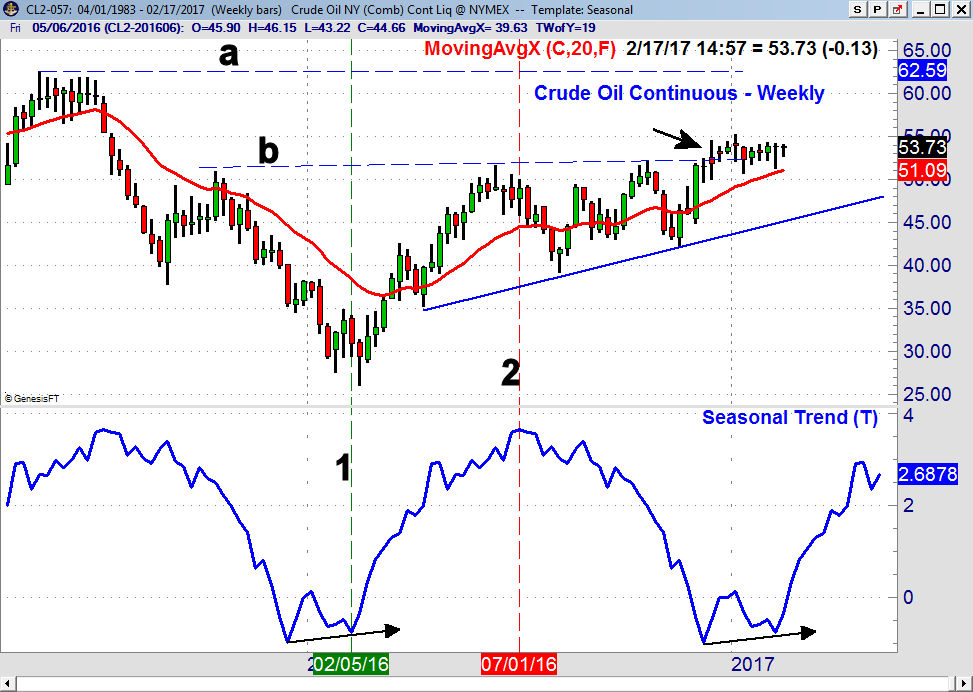
Crude oil, using data going back to the early 1980's has a seasonal tendency to form a double bottom in early February, line 1, and then stay strong until July (line 2). Crude oil has traded in a range lately after overcoming important resistance, line b, in December. The breakout has next upside targets in the $60-$62 area.
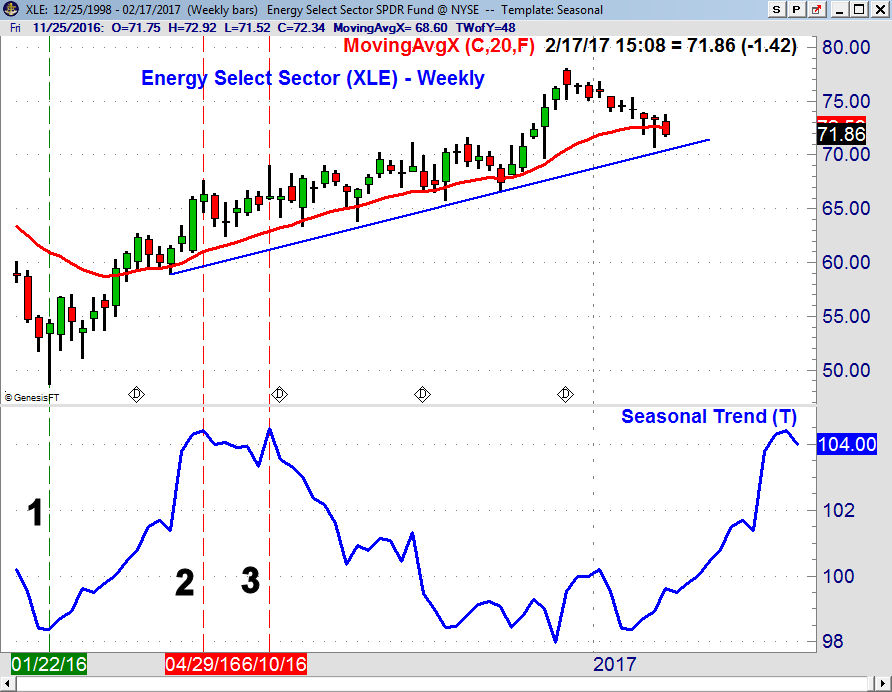
Since peaking in December the Energy Sector Select (XLE) it has declined for the nine weeks in a row as it has lost almost 8%. In contrast crude oil is pretty much unchanged so far in 2017. XLE typically bottoms on January 22nd, line 1 and then forms an initial top in late April, line 2. A secondary high or double top is then formed in early June. The weekly relative performance and OBV for XLE needs a strong close in the next few weeks to move back into positive territory.
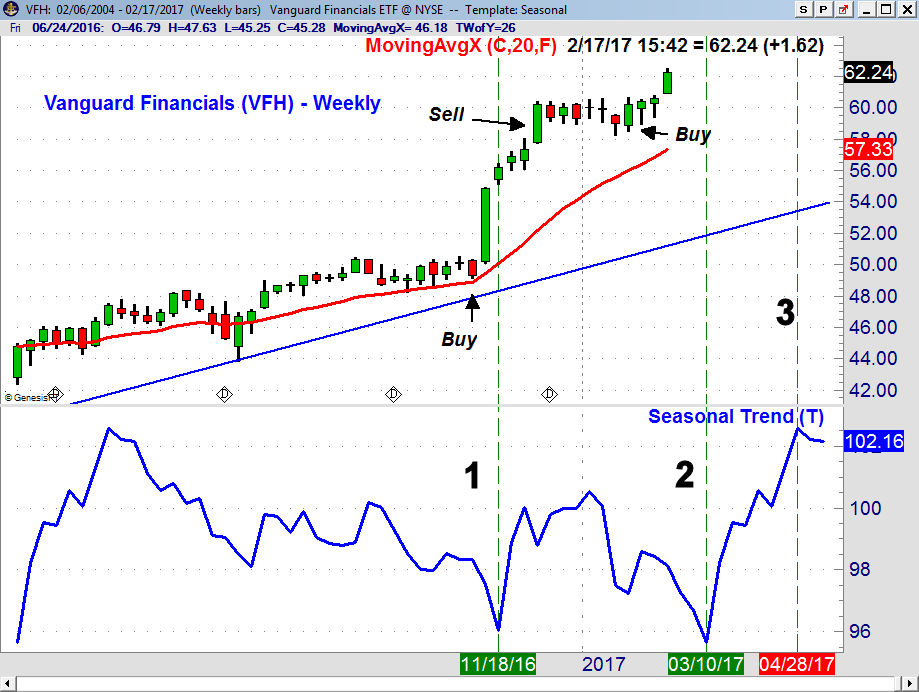
For the financial sector I prefer the Vanguard Financial ETF (VFH) which as 400 holdings as compared to 63 in XLF. On the chart I have included the recent buy and sells for investors from the Viper ETF Report. as longs were recommended in late October. A 16% profit was taken in early December and new longs were recommended in the latter part of January.
The seasonal tendency is for an initial bottom in the middle of November (line 1) and then a secondary bottom at the start of March, line 2. It typically peaks at the end of April. The comments on rates from Fed Chair Janet Yellen last week have pushed VFH sharply higher. The weekly technical readings for VFH look strong.
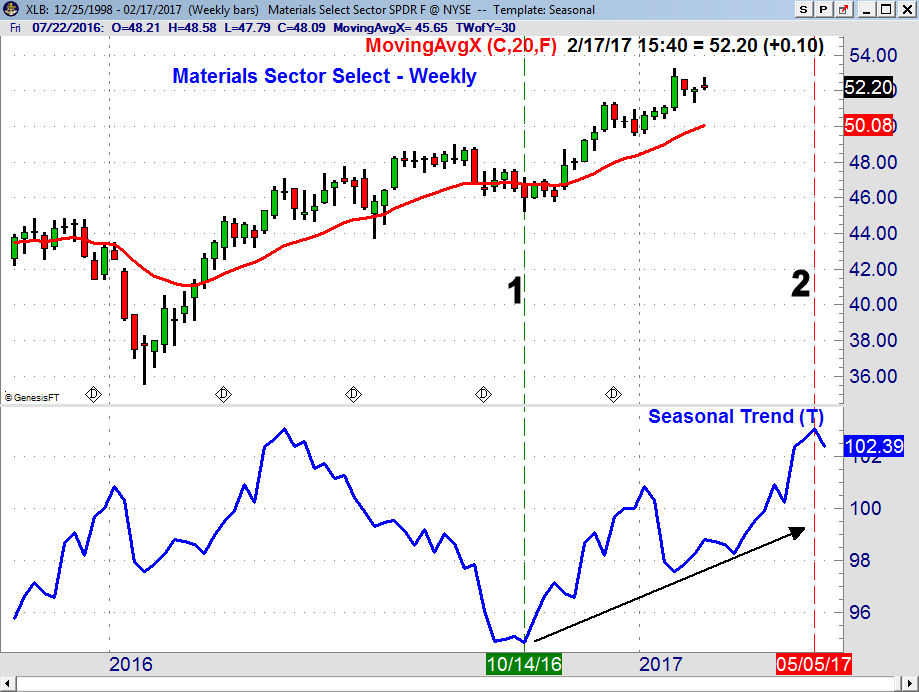
The Materials Sector Select (XLB) made its recent low on October 14th which was right on target with the seasonal pattern. After an interim peak in early January XLB again moves higher and typically tops in early May. It has not made new highs recently but still is in a positive intermediate term trend.
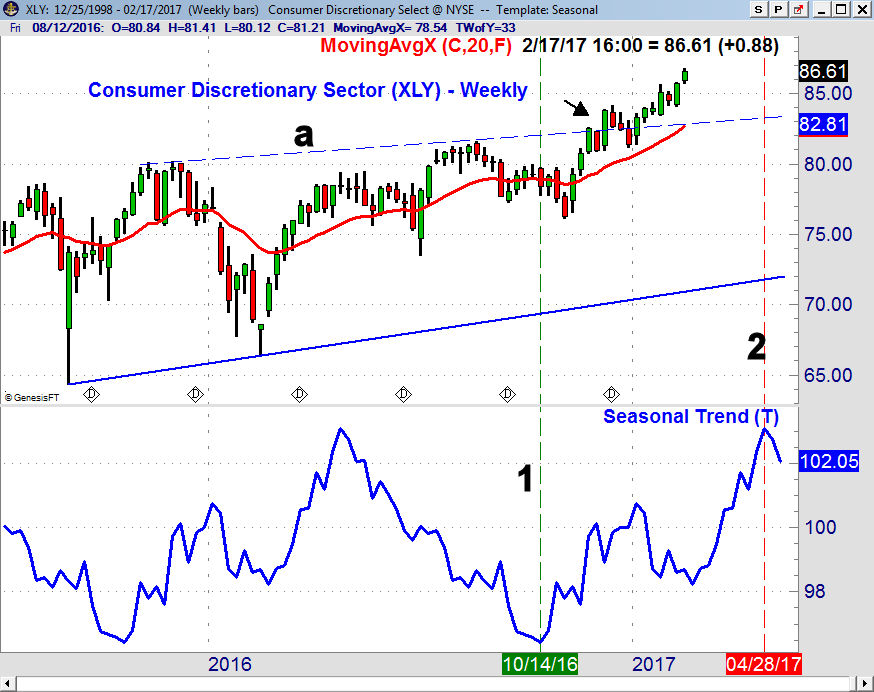
The Consumer Discretionary Sector (XLY) broke out above the 2015-2016 highs, line a, in early December which had initial upside targets in the $90 area. The seasonal tendency is for XLY to bottom in the middle of October (line 1) and then tops at the end of April, line 2. The 20-week EMA was tested after the breakout and has turned up more sharply. Viper ETF clients are also long XLY, as they are XLB and XLE.
The Economy
The Consumer Price Index came in at 0.6% double the consensus estimate as it has broken out of a three-year range. The Retail Sales were also strong as they came in at 0.4% while the economists were expecting just 0.1%.
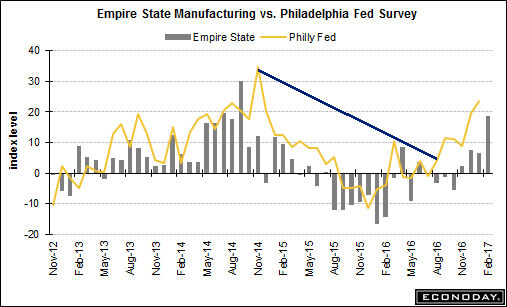
The Empire State Manufacturing Survey came in at a strong 18.7 well above the consensus of 7.5. Then on Thursday the Philadelphia Fed Survey surged to 43.3 almost double last month's reading of 23.6. I have been discussing the improvement in this survey since it broke the downtrend last fall and it continues to look very strong. This bodes well for the months ahead.
On Tuesday we have the PMI Manufacturing Index followed on Wednesday by the Existing Home Sales and FOMC minutes. There is more on manufacturing Thursday with the Chicago Fed National Activity Index and then the PMI Services Index. To end the week we have New Home Sales and Consumer Sentiment on Friday.
Interest Rates & Commodities
The yield on the 10 Year T-Note was a bit higher last week but closed well below the week's high at 2.524%. The 10-week trading range is still intact as a weekly close above 2.555% is needed to signal an upside breakout while there is key support in the 2.300% area.
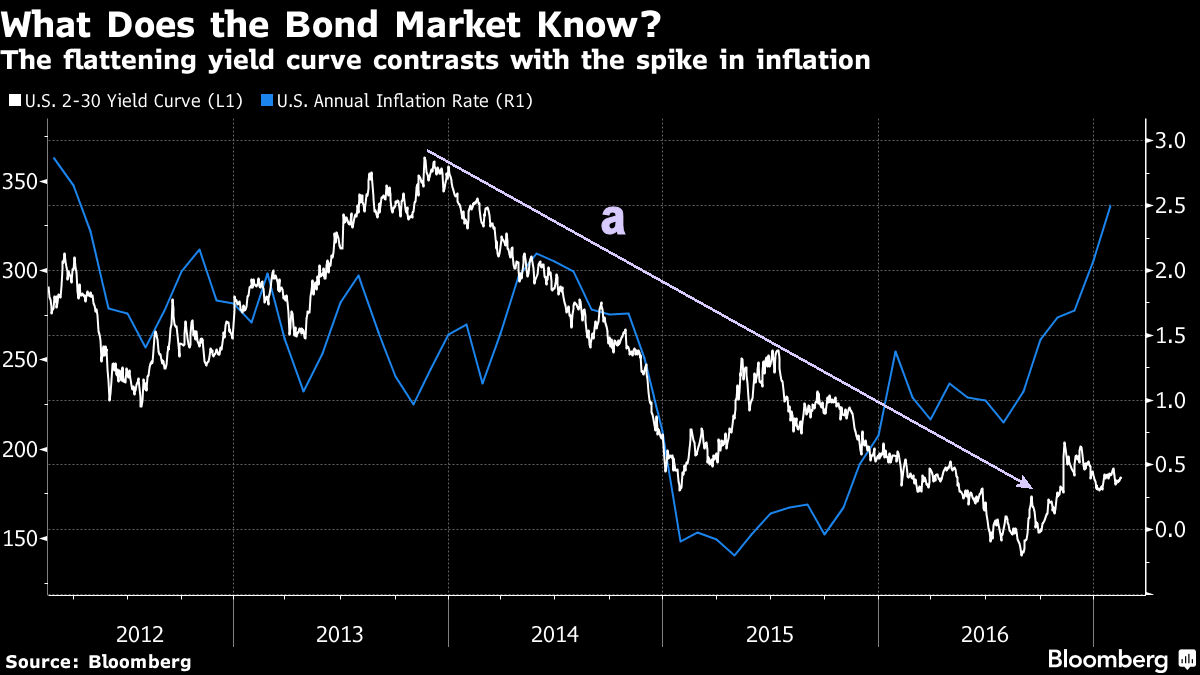
This interesting chart from Bloomberg shows that the spread between the 2 and 30 year has broken the downtrend, line a, that goes back to the late 2013 highs. The chart does suggest that the yield curve has bottomed which could have important implications for the economy in the next year or so. The US annual inflation rate (R1) is also plotted and it shows a powerful upturn and a move well above the 2012 highs.
Despite the rise in the inflation rate the rally in the Market Vectors Gold Miners (GDX) has just reached the 50% retracement resistance of the decline from the August 2016 high at $25.08. The 61.8% resistance is at $26.64 and a move above this level is needed to suggest that an important low is in place.
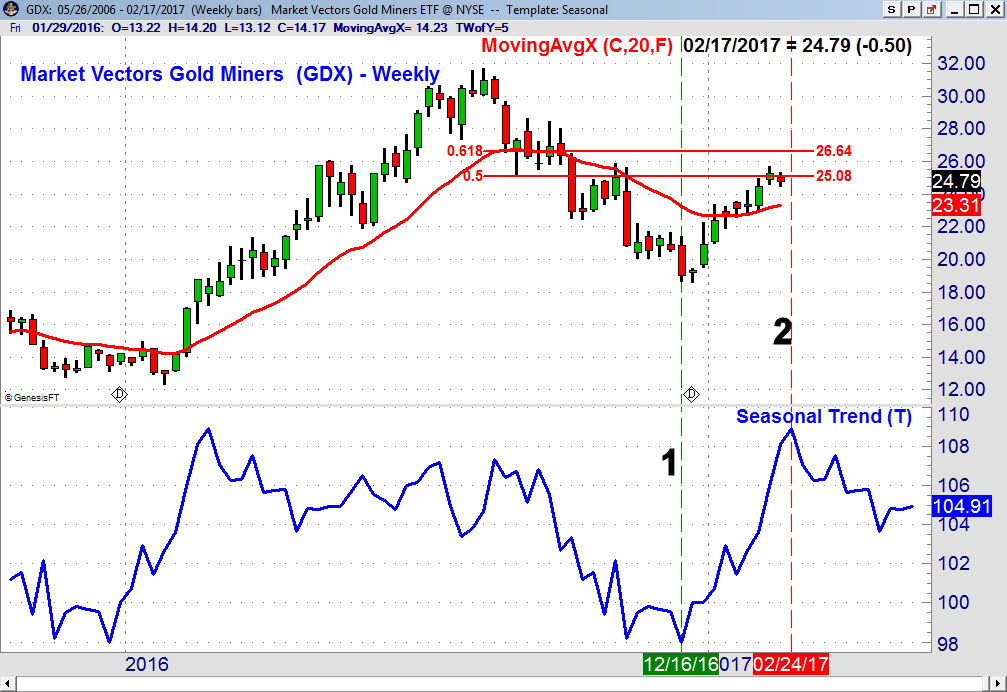
The seasonal analysis shows that GDX typically bottoms in December, line 1, and then tops out in late February (line 2). Of course the seasonal tendencies always need to be confirmed by the technical readings before action is taken. The weekly OBV (not shown) did bottom at the end of 2016 and it is still above its rising WMA. The daily OBV does look more toppy so stay tuned.
Market Wrap
It was another week of impressive gains with the Dow Industrials up 1.75% and the Nasdaq Composite up 1.82%. The S&P 500 did almost as well as it was up 1.51% while the Russell 2000 was up just 0.79%. The advancing stocks led the decliners by a narrow margin of 1606 to 1501. These numbers were not as strong as I would like to see.
In the week ending December 9th the A/D numbers were similar and the Dow Industrials was up also up 1.75%. The following week the SPY formed a doji and consolidated for three weeks before moving higher in January.
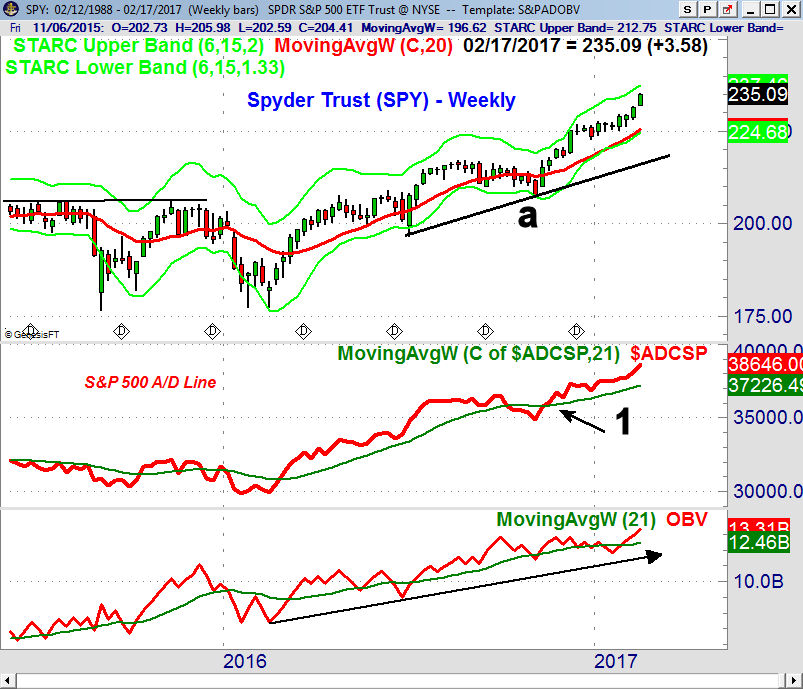
The SpyderTrust (SPY) has continued to accelerate to the upside as it has gained 2.5% in the past two weeks. The weekly starc+ band is at $237.46 with the quarterly pivot resistance at $240.04. The rising 20 week EMA is at $225.59 which is 4% below Friday's close.
The S&P 500 A/D line moved above its WMA on November 18th (point 1) and has turned sharply higher in the past few weeks. Since the A/D line continues to make new highs with prices there are no signs of an intermediate term top. The daily A/D line (not shown) has also made new highs and is well above its rising WMA. The weekly OBV has also made new highs and is positive.
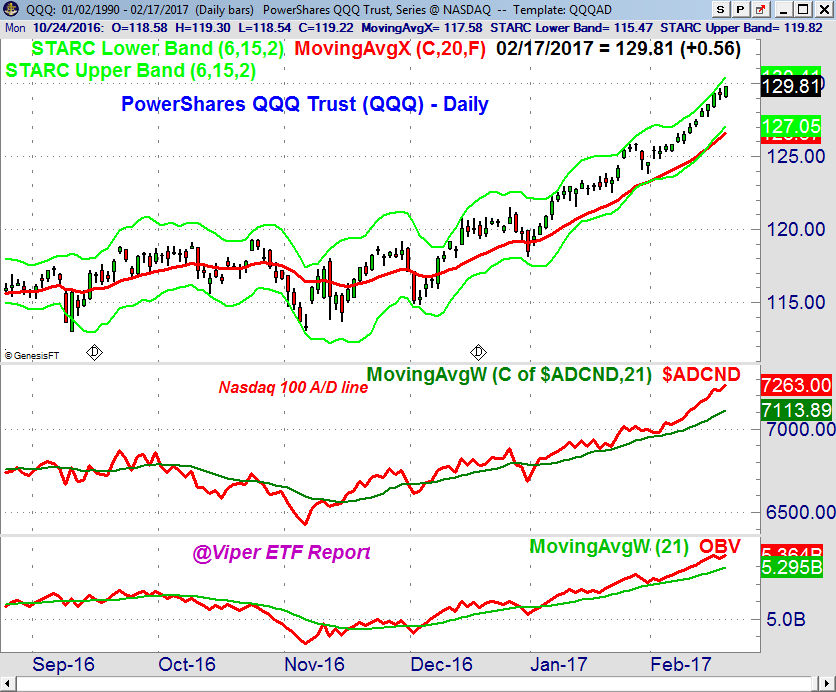
The Powwershares QQQ Trust (QQQ) was up 1.91% last week as it closed above the yearly pivot resistance at $128.73. The monthly pivot resistance is at $130.16 with the weekly starc+ band at $131.57. There is initial weekly support in the $125.35-$126 area.
The weekly Nasdaq 100 A/D line is rising sharply and is acting very strong as is the OBV. There are no signs of a top from the daily A/D lines as it is leading prices higher. The QQQ did form a doji on Thursday with the strongly rising 20 day EMA at $126.57.
The small cap stocks are still lagging but the completion of the trading range in the iShares Russell 2000 (IWM) suggests that it should be ready to catch up in the next few weeks.
What to do? The fact that all of the A/D lines are in the trending mode except for the small cap Russell 2000 does favor further gains as we head in March and April. Though these are often two of the best months for sector ETFs that does not mean we won't see a 1-3% correction in the next few weeks.
Such a pullback should be well supported but it is needed to cause an increase in the too quiet bearish commentary. At current levels the risk/reward is the best in the small cap stocks though the new uptrend has not yet been confirmed yet by new highs in the Russell 2000 A/D line.
Viper ETF traders took partial profits in the QQQ on Thursday and may do the same if the SPY gets close to the $240 level. Investors are sticking with positions until there are more serious warnings from the daily and weekly A/D lines as they are holding positions in a number of well performing sector ETFs.
For those interested in trading stocks you might consider the Viper Hot Stocks Report . New subscribers receive five recent Trading Lessons can help you become better investors and traders. The 4-5 page ETF and Stock reports are sent out twice a week and each report is only $34.95 each per month. Subscriptions can be cancelled on line at any time.


