The severity of the fall stock market decline has shaken the belief of some investors in the bull market. For those who have not been following the stock market for more than a few years, their reaction is understandable. But those with a longer-term perspective are wondering what the recent decline means for their portfolio.
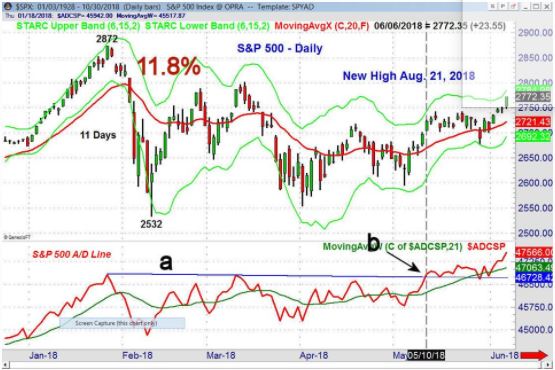

Many were asking themselves the same question in early February, when the S&P dropped from 2873 at the January 26th high to a low of 2532 in just eleven days. From high to low this was a change of 11.8% . Four days after the high, the S&P 500 A/D line had dropped below its WMA.
The initial drop was followed by three months of range-bound trading, as many investors gave up on the bullish case, while those who bought in January may have given up on stocks.
Patience was clearly required, as the major averages traced out 2-3 month continuation patterns. I monitored the resistance in the A/D line for several months (line a) until it was finally overcome on May 10 (point b).


The speed of this October decline started to worry some strategists on Monday, October 19th. The Dow Industrials had a 900-point range during the day and then closed lower.
Even though the stock market rallied for the last two days of the month, there are no clear signs from my advance/decline analysis that the worst of the selling is over.
The S&P 500 daily advance/decline line had dropped well below its WMA on October 4, and made a new correction low on October 29. The A/D line shows a well-established downtrend (line a) that needs to be overcome in order to signal that the worst of the selling is over.
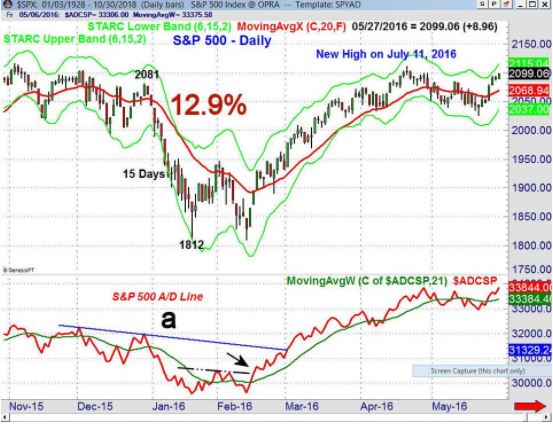

In December 2015, the S&P 500 had formed a series of lower highs, culminating in the high on December 29 at 2081. The S&P then turned lower and gapped lower to start off the New Year.
The S&P 500 declined steadily for the next two weeks finally making a low of 1812 on January 20. This was a decline of 12.9% that lasted 15 days. The S&P 500 was very oversold, and rallied for eight days until February 1.
The rally was followed by an eight-day decline as the S&P 500 made a marginal new low at 1810. Three days after the low, the initial A/D line resistance was overcome and the technical evidence pointed to a completed market bottom (Is There Blood In the Streets Yet?). The downtrend in the A/D line (line a) was broken before the end of the month. It was not until July 11 that the S&P 500 made a new high.
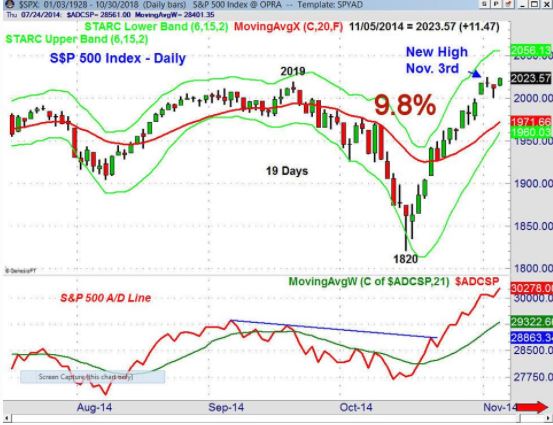

Before another mid-term election, in 2014, there was another sharp market decline. The S&P 500 formed a doji high at 2019 on September 19, 2014, and then closed the next day below the doji low triggering a doji sell signal. In just 19 days, the S&P 500 dropped 9.8%, making a low on October 15th.
Reports at the time suggested that hedge funds were on the wrong side of the market which may have also been the case this year. The rebound from the lows in 2014 was impressive, as just thirteen days after the low, the S&P 500 was able to make a new high.
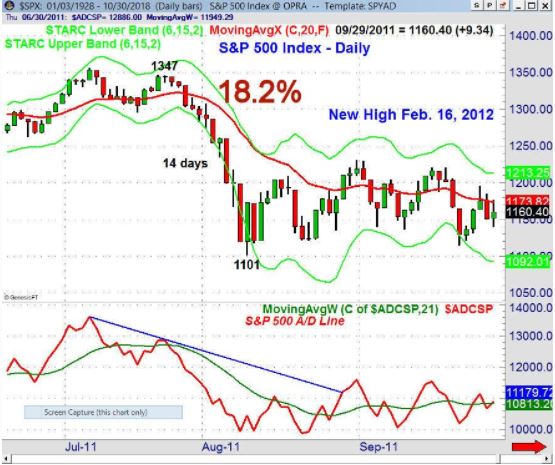

Several of the corrections in this bull market have had more than one stage. This was the case for the correction that began in July 2011, after the S&P peaked at 1347 on July 21. This was the second attempt in July to move above the early May high of 1370.
The downgrade of US debt and budget impasse pushed the S&P to a low of 1101 on August 9. This was a decline of 18.2% in just 14 days. The S&P did not make its final correction low until October 4, when the S&P had a low of 1074 but then closed the day at 1123.
This reversal was impressive, and the next week I commented “Despite rampant bearishness, the Advance/Decline (A/D) lines for major stock indices suggest the formation of a market bottom.”
At the low, the S&P was down just over 20% from the July 21 high. The S&P 500 did not make a new high until February 12, 2012. This I believe was a result of the technical and psychological damage that was caused by the market decline. After rallying 20% from the October 4 low, the S&P peaked on October 27, and then underwent a 10% decline that ended just after Thanksgiving.
As part of my advance/decline analysis, I monitor the advance/decline lines associated with the Invesco QQQ Trust (QQQ), iShares Russell 2000 (IWM), the SPDR Dow Industrials (DIA), and the NYSE Composite.
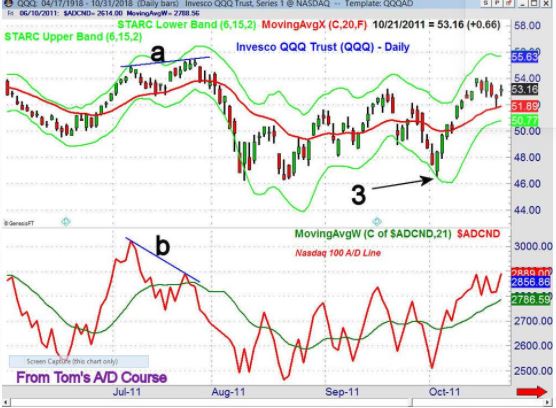

This review of all of the key advance/decline lines can provide additional insight at key market turning points. For example, at the July 2011 high there were stronger sell signals from the Invesco QQQ Trust (QQQ) and the Nasdaq 100 A/D line.
The QQQ formed higher highs in July (line a), but they were not confirmed by the market internals. The Nasdaq 100 A/D line formed sharply lower highs (line b), and this pronounced negative divergence was a sign of weakness. At the early October lows, the QQQ and it’s A/D line did not make new lows. This was in contrast to the new lows in the S&P 500.
The extent of the plunge in October 2018 plunge suggests the major averages are unlikely to return soon to their all-time highs like they did in 2014. The sharp rebound this week is likely to be hit by another round of selling.
I am also somewhat concerned by the number of analysts this week who now think the stock market has bottomed. At all of the correction lows that I have reviewed in this post, there was still a high degree of negative sentiment even a few weeks after the price low.
The lack of that bearishness could be a sign that we may have another sharp wave of selling before the bottom is complete. If you monitor and study technical studies, like the advance/decline line, you can survive this as well as future corrections. For investors there are no signs of a major top.
In my Viper ETF Report and the Viper Hot Stocks Report, I provide market analysis twice a week with specific buy and sell advice. New subscribers receive five trading lessons for just $34.95 each per month.
Comments
comments