

The ability of the S&P 500 to close well above the May 2015 highs has not really diminished the debate over the market's future. The somewhat surreal Republican Convention that seemed to contradict decades of past policy did not seem to impact the stock market.
The opinion of the fundamental analysts has seen little change despite the new highs as they continue to believe they are not justified by their analysis. A few of the bears have converted to the bullish camp but most have not as the majority continue to argue why the market must be forming a major top.
The individual investor according to AAII was a bit less bullish last week as the bullish% dropped to 35.4% which is still well below the 40% level. The bearish% rose to 26.7%. As of July 19th Investor Intelligence reported that 54.4% of financial newsletter writers were bullish with only 23.3% bearish. Historically the bullish% has risen to well over 60% at a market top while the bearish % has been below 15%.

One of the more interesting arguments for why the market must be topping out is based on the observation that there is a surge in the construction of tallest buildings prior to a major recession or market top. I found this chart, which chronicles these observations since 1900, quite interesting. New tallest towers are under construction in Dubai, Shanghai and San Francisco.
The frustration expressed by some Wall Street professionals has its roots early in the year as advisors, like the Royal Bank of Scotland (RBS), advised their clients to sell everything. The recent data on institutional cash levels also suggests that many managers have missed this rally.
It is not surprising that many mutual funds have performed poorly in 2016 and that many clients are not very happy. Therefore any panic on Wall Street maybe based on the fear of further redemptions and a loss of business if managers continue to lag their benchmarks in the 3rd quarter.
Many feel that the recent surge to new highs in the S&P 500 is a fake out while others are convinced that the completion of the two-year trading range in the S&P 500 means that the market can go higher. Instead of just looking only at prices I suggest that investors look at the breakout in terms of the market internals.
As I commented in April "Charts Talk-Fear Walks" the new highs in both the NYSE Advance/Decline and S&P 500 A/D lines ... means that the NYSE Composite and S&P 500 are both likely to make new highs". Even though the NYSE is still 4% below its 2015 high the completion of the weekly trading range does project an eventual move to new highs.
It is my view that the ability of the NYSE Advance/Decline line to overcome year long resistance is a sign of strength and that it has implications for the market that are likely to carry over until next year. looking at what has happened after similar A/D line breakouts can help us better prepare for the weeks ahead.
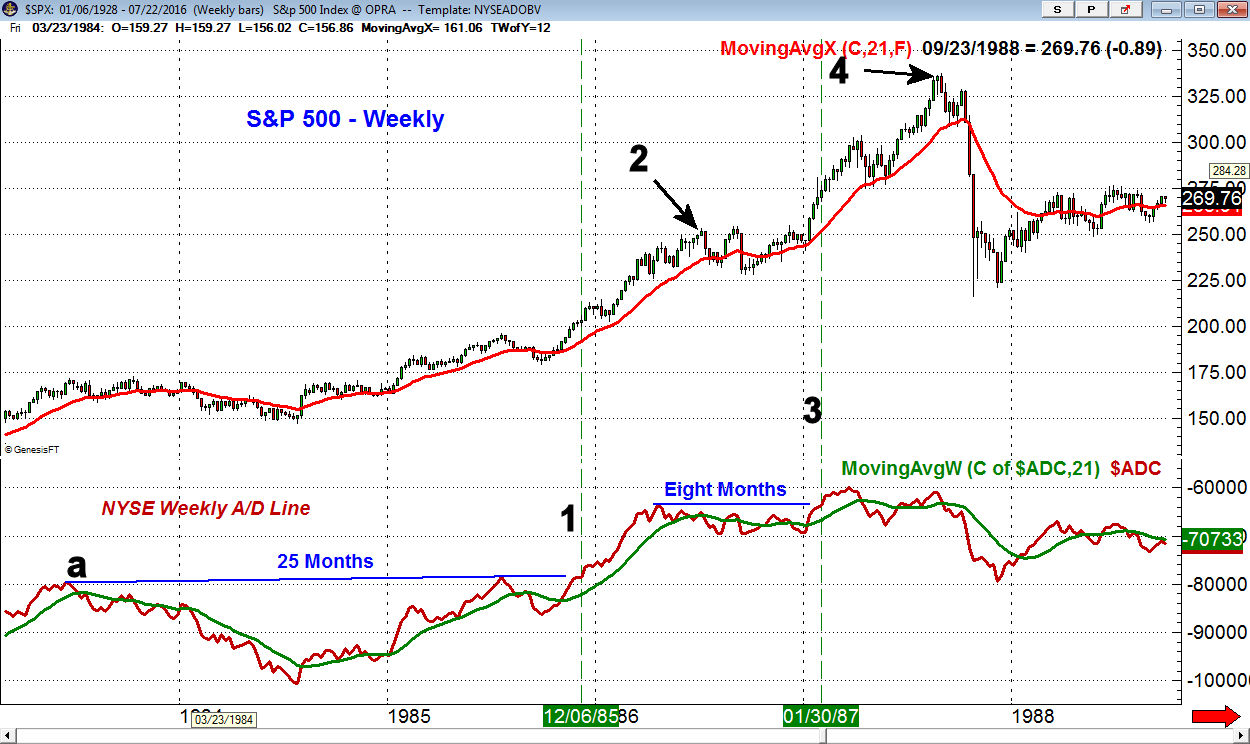
The NYSE A/D line was in a 25 month trading range between June 1983 and December 1985, line a. The completion of this range (line 1) occurred after ten weeks of solid gains. It was followed by a five-week rally before the market pulled back for a few weeks. By July of 1986 (point 2) the S&P 500 had gained over 24%.
The A/D line had peaked ahead of prices in April 1986 and did not break out to new highs until January 30, 1987 as it stayed in the trading range for eight months, line b. By the time the S&P peaked in late August of 1987, it had gained 23%. As the S&P was making its high the NYSE A/D line as noted last time (see chart) had formed a significant bearish divergence which warned in advance of the October crash.
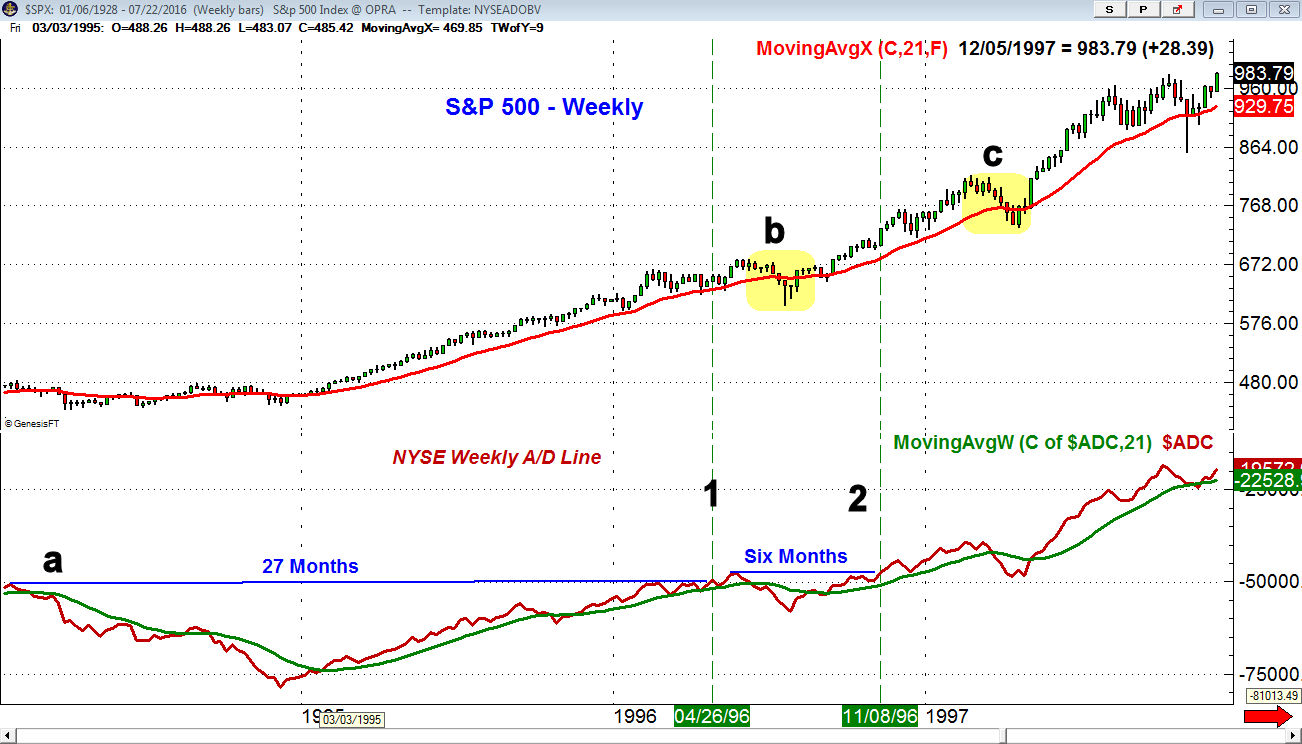
In 1994, the A/D line peaked and it was not until April 26, 1996 (line 1) that the A/D line was able to move to new highs, line a. After a minor 4% rally the S&P 500 underwent an eight-week correction (point b) that dropped the S&P 500 over 10%. By November 1996 the new rally in the S&P 500 was confirmed, line 2, as the NYSE A/D line had broken out of its six-month range.
In the following sixteen weeks the S&P rose another 11.9% as it peaked in the latter part of February. On the following eight-week correction (point c) the S&P 500 dropped 10%. The A/D line dropped below its WMA three weeks after the high but did not form any bearish divergences. Two weeks after the correction low the A/D line had already moved back above its WMA.
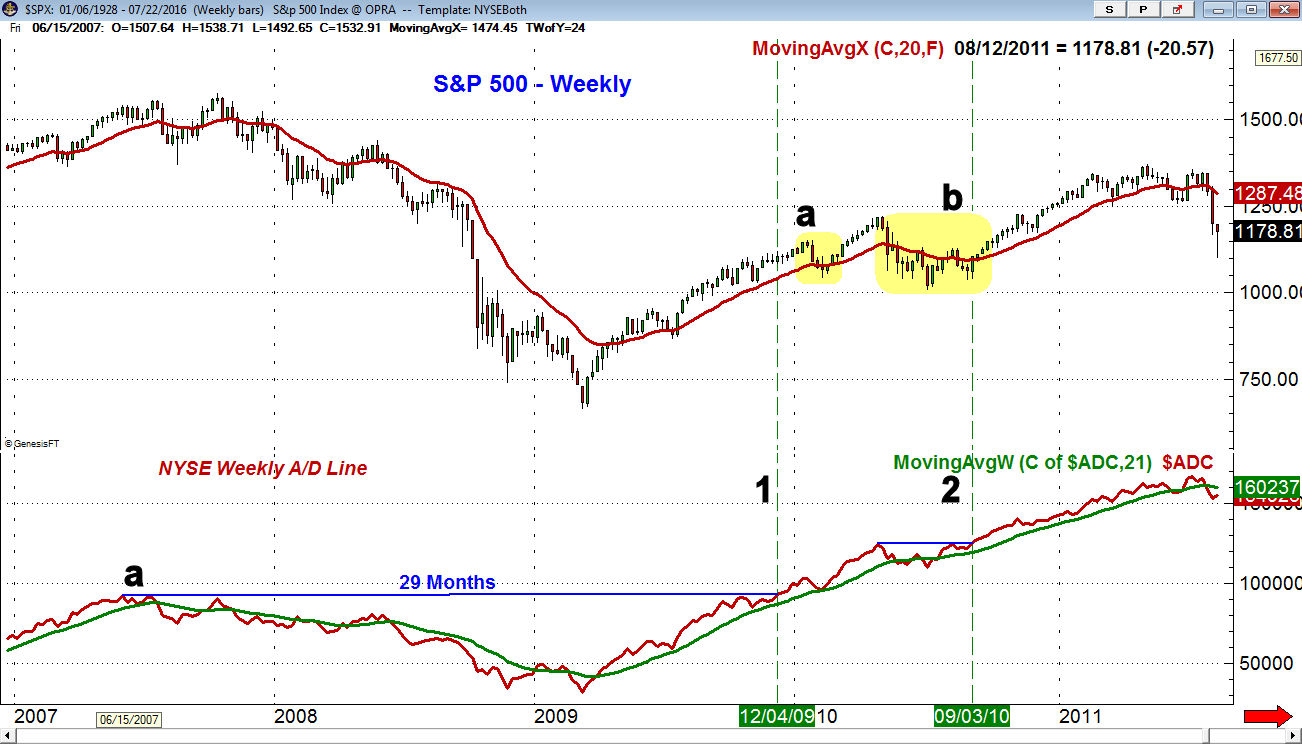
The most recent example of a long-term breakout in the A/D line occurred in December 2009 (line 1) as it was finally able to overcome the highs from 2007, line a. This time the S&P 500 just rallied 4% before it underwent a three-week correction of 9% (point b). The weekly A/D line just dropped back to its rising WMA on the pullback before it again turned higher. By April 2010 the S&P 500 had gained over 10%.
The correction from this high amounted to a drop of 17% and was not over until September 3, 2010 (line 2) when the A/D line moved to new bull market highs after breaking out of a five month trading range. I discussed this at the time Advance/Decline Line Hits New High.
Those who bought the PowerShares QQQ Trust (QQQ) based on the Viper ETF methods had a 28% gain in the next six months. By April of 2011 the S&P 500 had gained just over 24%. In July the A/D line dropped below its WMA which warned of a deeper correction.
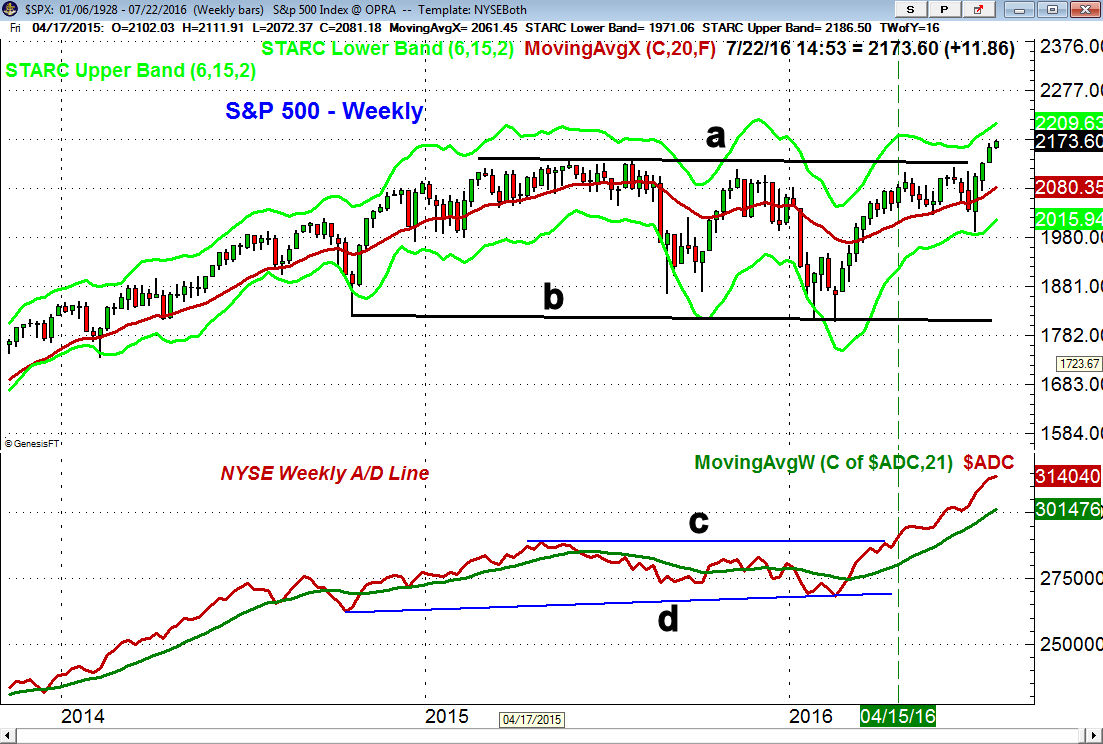
So what does this mean for the current market? The weekly chart shows the completion of the S&P 500 trading range, lines a and b, last week. The width of the long-term range is an eye-popping 324 points so when added to the breakout level at 2135 it gives you a potential S&P 500 upside target of 2459. Of course one would never invest based on this projection as markets never go straight up or straight down. There are many hurdles to overcome before these long term targets could be met.
Since the NYSE A/D line has broken out at 2080, the S&P 500 has gained another 4%. At the time it was already up 14% from the February lows. My upside targets from the daily chart have been in the 2180-2200 area. The quarterly pivot resistance is at 2199 with the weekly starc+ band at 2209.
The fact that the market has had little in the way of a pullback over the past eighteen days suggests that we should be prepared for a 1-2 week pullback in the next month or so. The period from late August through September is a seasonally weak period for the stock market . There should be plenty of warning from the daily A/D analysis before we see a meaningful correction.
Such a correction should be the next good buying opportunity for investors as the market should then move even higher. A 10% rally from the A/D line breakout level of 2080 would give us an upside target of 2288. These I think is a reasonable upside target for the latter part of 2016 and early 2017.
This does not mean that one should be complacent as there are still challenges from the overseas markets which I will update next week.
The Economy
The Housing Market Index last Monday declined slightly but still reflects solid growth as builders in the West are especially optimistic. Housing Starts continue to rise while Existing Home Sales also improved in June.
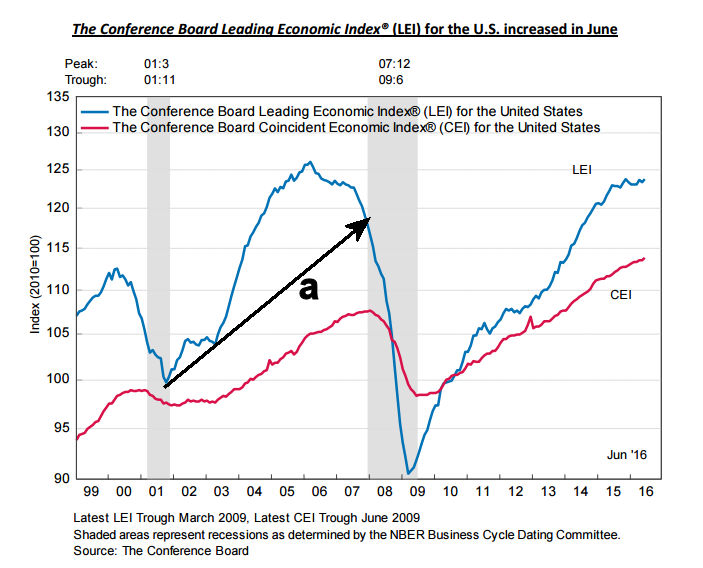
The Philadelphia Fed Business survey was weaker than expected at -2.9 as it reversed June's gain. The Chicago Fed National Activity Index was a bit better than the consensus estimates. The Leading Economic Indicators (LEI) rose 0.3% in June which reversed the slight decline in May. As I have commented in the past it has a good record of topping out well before the start of a recession. It peaked in early 2006 and then broke its uptrend, line a, in the latter part of 2007. It will take 3-4 months of deterioration before it could top out.
The flash reading on the PMI Manufacturing Index rose to 52.9 which may be a good sign for the manufacturing sector in the weeks ahead.
On Monday we get the Dallas Fed Manufacturing Survey followed on Tuesday by the S&P Case -Shiller HPI, PMI Services Index, New Home Sales, Consumer Confidence and the Richmond Fed Manufacturing Index. The FOMC meeting also starts on Tuesday.
Durable Goods are out on Wednesday along with Pending Home Sales Index and in the afternoon we have the FOMC announcement. On Friday we get the advance reading on 2nd quarter GDP, Chicago PMI and the month end reading on Consumer Sentiment which did decline sharply in the middle of the month.
Interest Rates & Commodities
The yield on the 10 Year T-Note held its gains from the previous week as it is well above the recent lows. On the upside the next resistance is at 1.700-1.750% while a drop below 1.450% will suggest a drop in yields back to the recent lows.
Crude oil was hit hard last week as the September contract dropped $2.44 at $44.22. The 50% support level is at $42.71 with the daily starc- band at $41.96. Gold closed well above the week's lows and I shared my detailed analysis of the gold futures last week in "Charts, Not Fear, Guide Gold Market".
Market Wrap
The Dow Industrials e up 0.3% last week while the Dow Transports lost just over 0.2% but the Utilities rebounded nicely as they gained 1.4%. Both the S&P 500 and small cap Russell 2000 were up over 0.6% and 1986 stocks advanced with just 1151 declining.
The technology sector led the way as it gained 2.2% much better than the 1.3% gain in health care while financial stocks were up just under 1%. Two of the tech winners last week came from the Viper Hot Stocks weekly buy list and were recommended in the past two weeks.
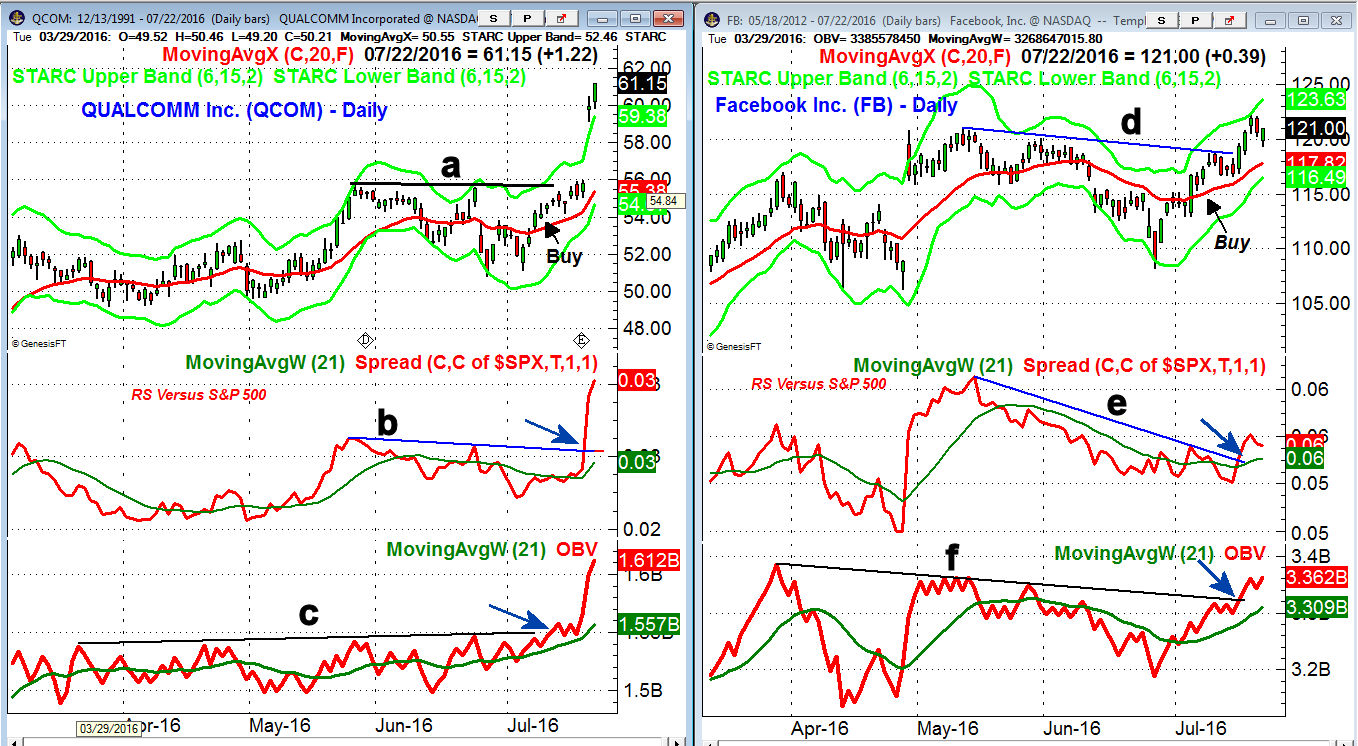
QUALCOMM Inc. (QCOM) was up 11.6% last week as it decisively broke through the resistance at line a. The weekly relative performance signaled it was a market leader in May and the daily OBV broke through resistance, line c, almost two weeks ago.
Facebook Inc. (FB) has earnings this week and gained 3.5% last week as it made a new all time high. The weekly and daily charts look strong as the daily RS broke its downtrend, line e, last week. The on-balance-volume (OBV) has moved above three-month resistance at line f, which has confirmed the price action. The completion of the weekly range has targets in the $133-$135 area.

The Spyder Trust (SPY) held firm last week and Friday's close suggests it looks ready to reach the $219-$220 area this week. The daily starc+ band is at $219.84 with the weekly at $220.71. The 20 day EMA and daily starc- band are now in the $214-$214.90 area.
The daily A/D line closed at another new high Friday has it held well above its WMA as prices moved sideways. On the Brexit vote decline the A/D line held the support, line c, that goes back to March. This now is the first important level of support with further at the May lows. The daily OBV made a new high for 2016 in June but is still below the 2015 highs.
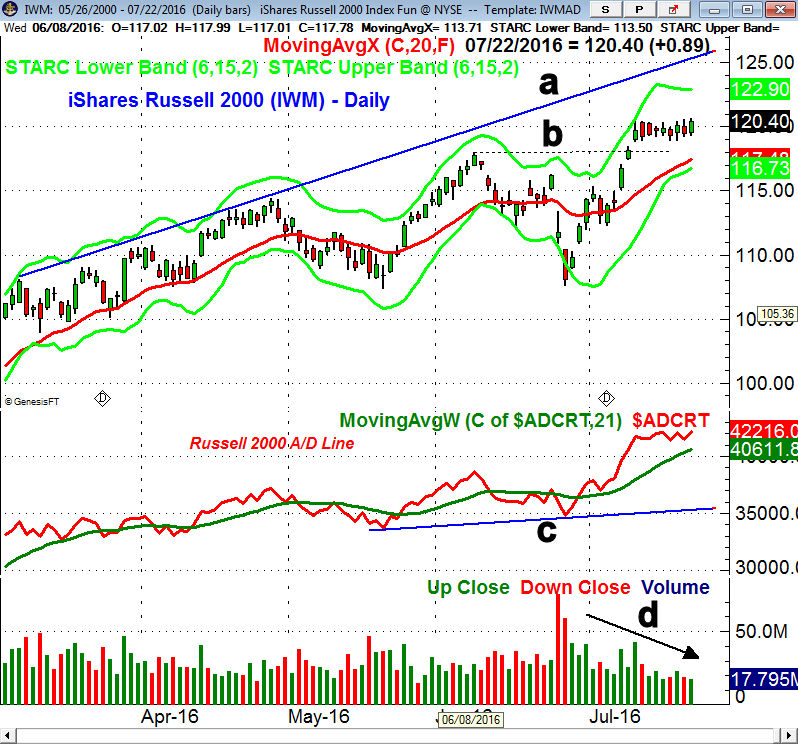
The iShares Russell 2000 (IWM) has traded in a tight range over the past nice days as it has held well above the early June lows, line b. The daily starc+ band is at $122.90 with the monthly pivot resistance at $124.90. The chart resistance from the March and April highs, line a, is now in the $125.50-$126 area. I will be looking for signs of a short-term top where traders should take profits.
The Russell 2000 A/D line held up better than prices in June and now has important support at line c. The pullback to its WMA on July 5th created a bullish buy setup. The 20 day EMA and near term support is at $117.48.
The PowerShares QQQ Trust (QQQ) is still slightly below the December 2015 high at $114.75 with the daily starc+ band at $115.45. The daily and weekly Nasdaq 100 A/D lines like those on the Dow Industrials are still acting stronger than prices.
What to do? The next two weeks should determine what kind of quarter it has been for earnings but so far it looks better than estimated which is what I have been expecting. This may help some tentative investors to move back in stocks. If yields continue to climb then we should also see funds move to stocks from bonds.
If the major averages get another strong close early this week then it will mean a sharper setback is likely to come from higher levels. Therefore those who are under invested should wait until we get a few sharp down days before they do new buying.
For more active investors and traders there are several ETFs where the risk/reward is better than in the market tracking ETFs. Specific advice on these ETFs is provided twice a week in the Viper ETF Report which is only $34.99 per month and includes my trading lessons. The subscription can be cancelled on line at any time.
Comments
comments