

The stock market was nervous prior to President Trump's speech to Congress but responded with a heavy wave of buying that pushed the Dow Industrials up over 300 points. The 32 point gain in the S&P 500 was also impressive but the small cap Russell 2000 was even stronger gaining 2% on Wednesday.
It appears that the stock market has finally gotten the public's attention as since the election the fund flows have indicated there was more public buying of stocks. Since the start of the year $124 billion has poured into ETFs and according to Blackrock individual investors accounted for as much as 85% of the inflows.
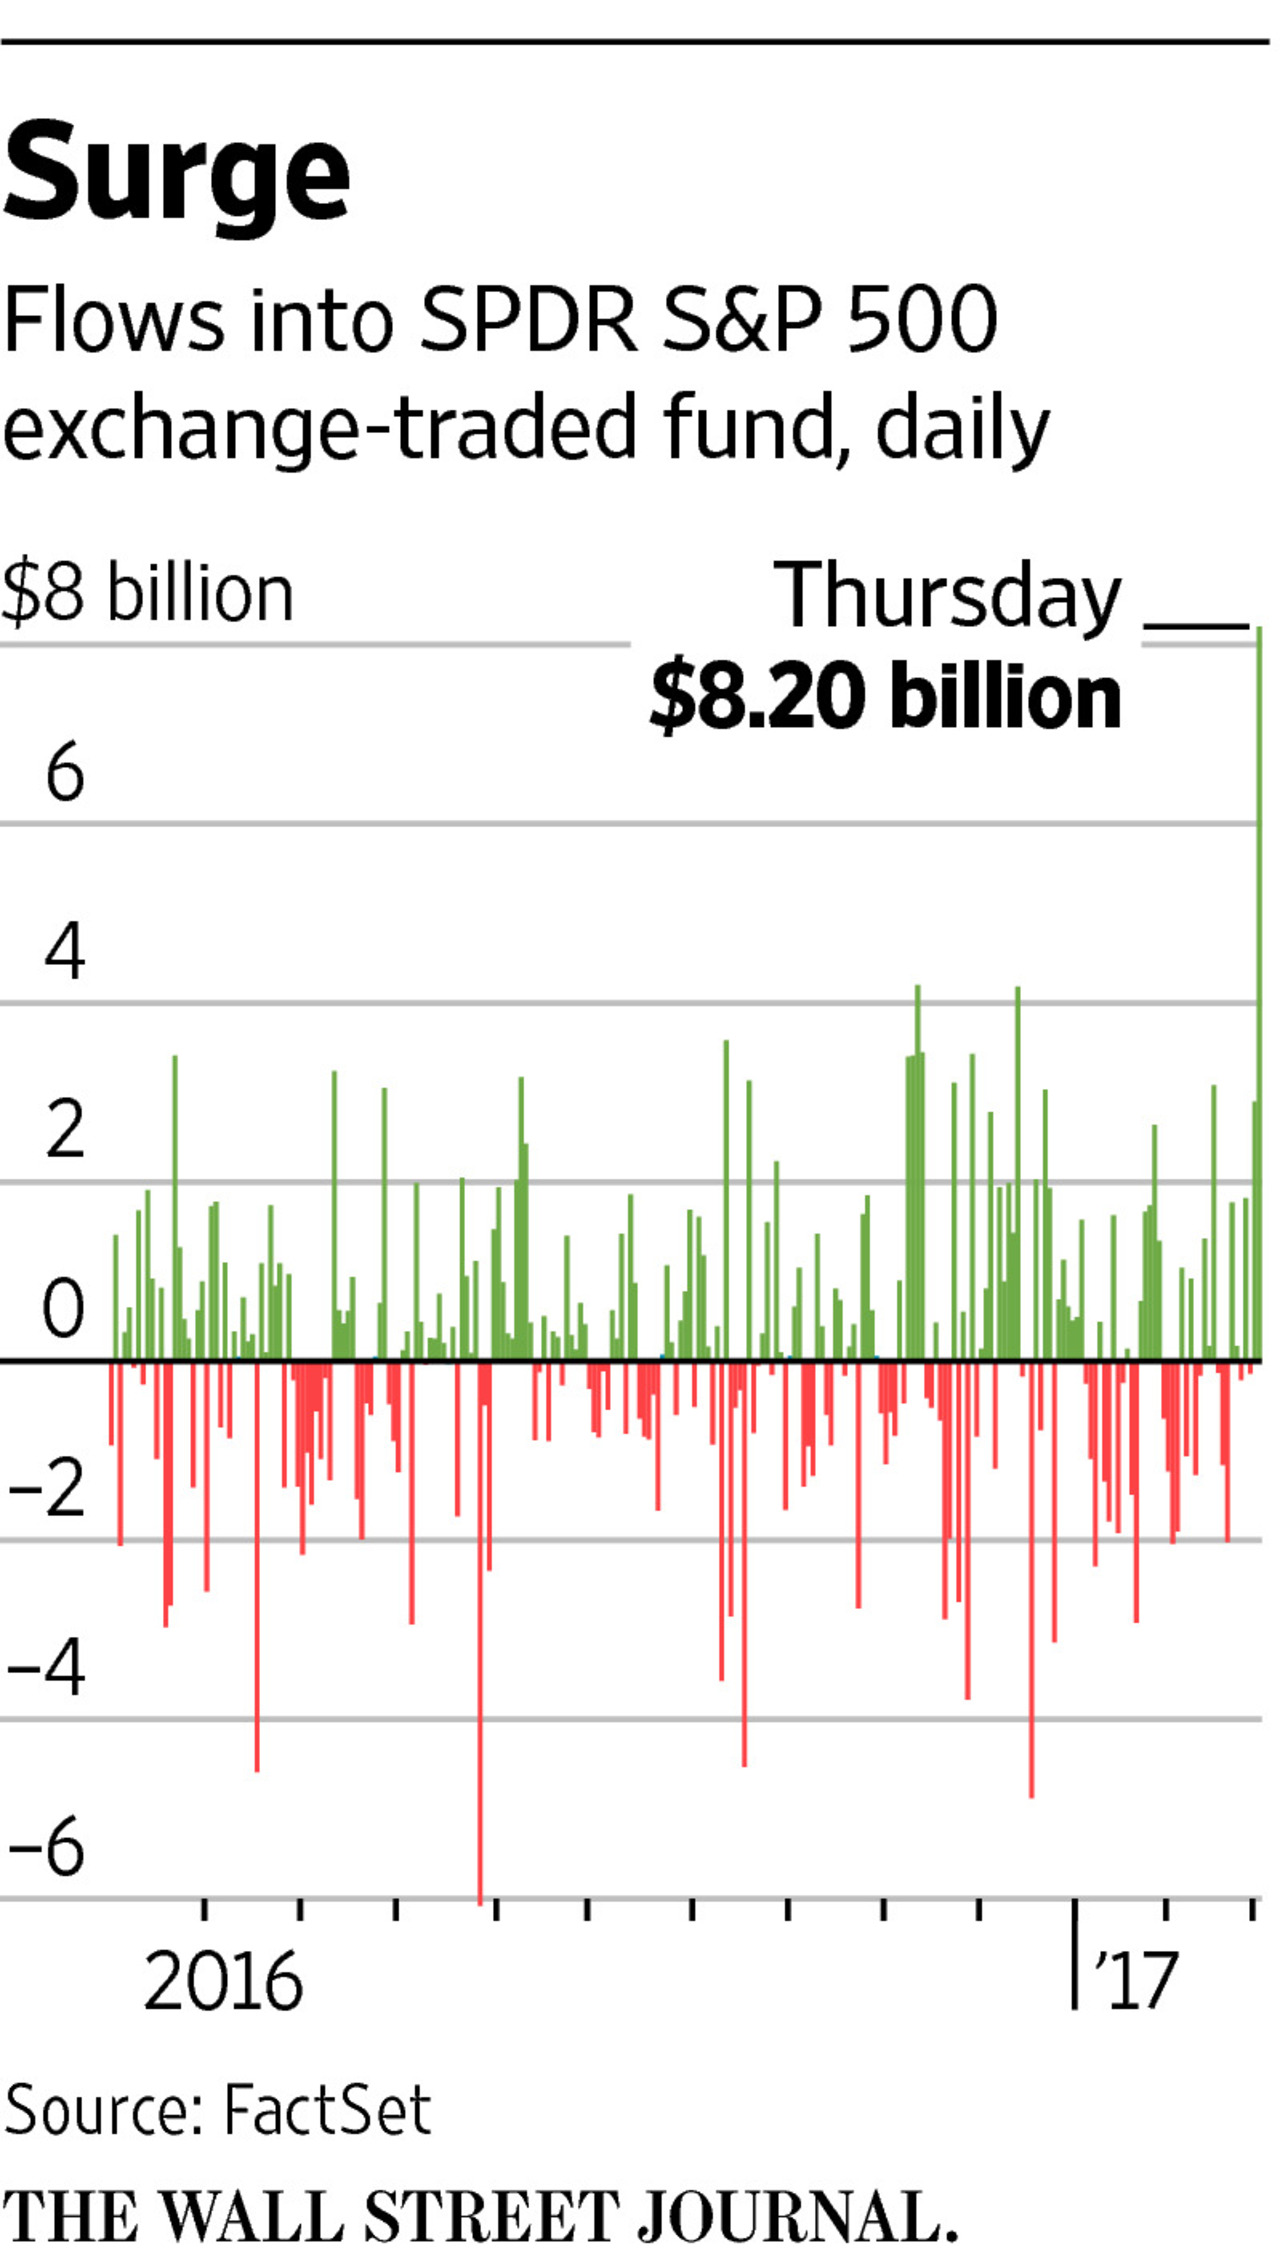
Last Wednesday $8.2 billion flowed into the Spyder Trust (SPY) which was the highest since 2016. As the arrow indicates the outflows at the end of the year were quite heavy as investors moved out at the wrong time. It has been my view since November that even though the new administration may not be able to actualize their lofting goals the major change in bullish sentiment is likely to last well into 2017.
The market enthusiasm is becoming a global affair as the world's largest pension fund, Japan's Government Pension Investment Fund, gained $92 billion in the last quarter of 2016. This was a return of 8% as the plunge in the Yen was clearly a factor.
One of the chart patterns I have found to be the most profitable are continuation patterns. These are pauses in a prevailing up or downtrend but generally last long enough so that traders and financial media get impatient and decide that the trend has changed. The stock market rebound in March-April of 2008 was a pause that lasted long enough to convince many that the bear market was over but the worst was yet to come.
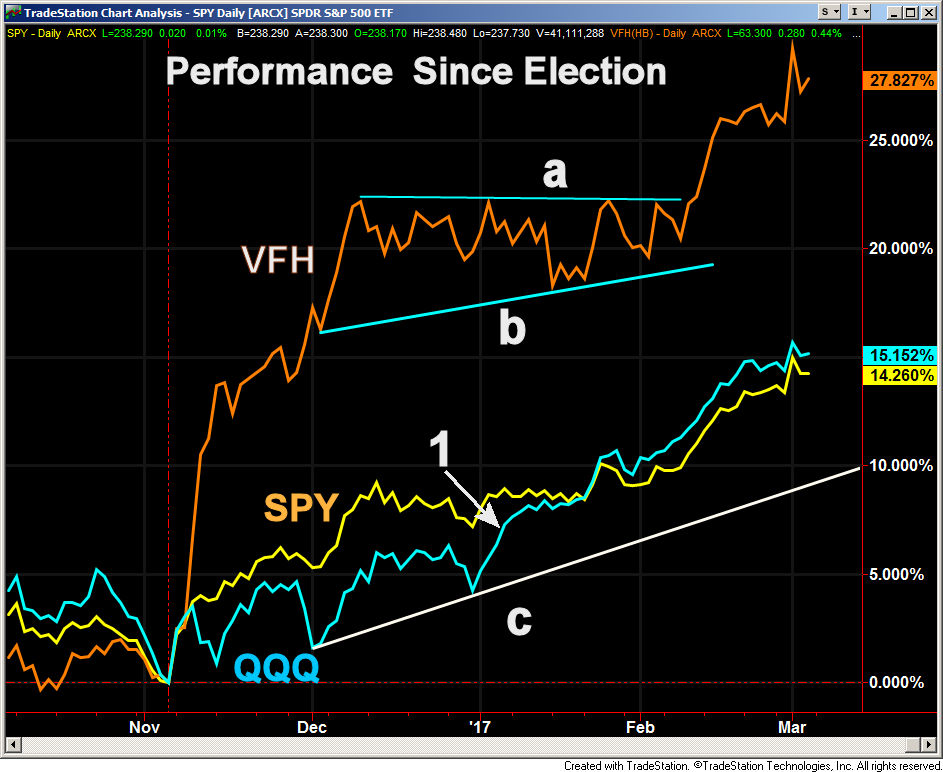
This percentage change chart shows the performance of the Vanguard Financial ETF (VFH, Spyder Trust (SPY) and the PowerShares QQQ Trust (QQQ) since the election. Viper ETF investors went long in late October and sold on December 6th for over a 16% profit as I felt the risk was too high. This was two days before the December high.
The chart shows that by early January it was becoming clear that VHT was indeed forming a flag or continuation pattern, lines a and b. By the middle of the month many traders and analysts had turned more cautious about the market and the financial sector. By the end of the month the technical studies indicated it was again time to buy VFH as well as KRE. By early February both had resumed their rallies.
The chart also reveals that QQQ broke out to new highs in early January, point 1, after forming a solid uptrend (line c). This confirmed the bullish action of the Nasdaq 100 A/D line in December that indicated a positive weekly and daily trend as well as the leadership of QQQ. It has been leading the SPY since early January.
Those who have been following the stock market since the start of the bull market may realize that the financial headlines have consistently warned investors to stay out of stocks. Just one month after the bear market low in March of 2009 Chrysler declared bankruptcy and many warned that the government's rescue plan would be a disaster.
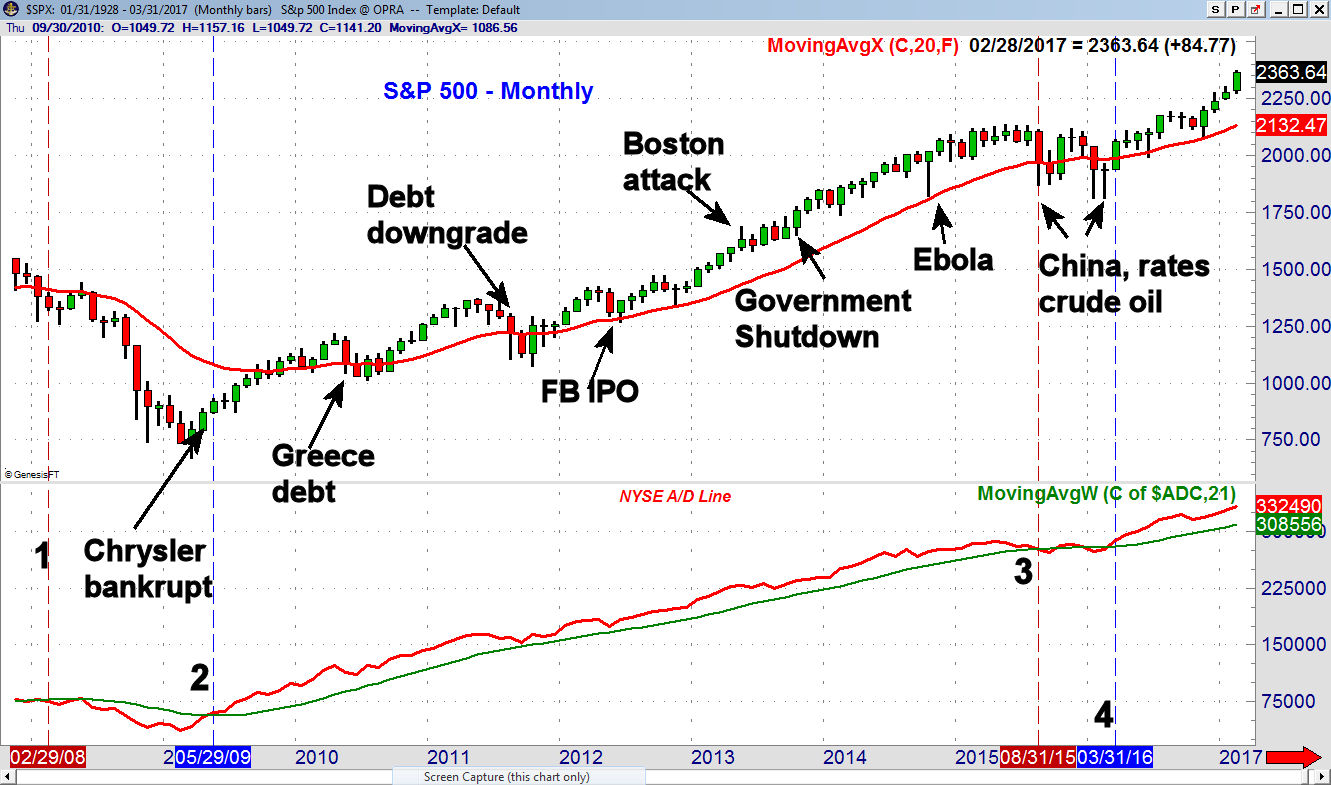
Below the monthly chart of the S&P 500 I have included the monthly chart of the NYSE Advance/Decline line which turned negative in February of 2008 (line 1) by dropping below its WMA. This gave investors plenty of time to get out of stocks on the bear market rally before stocks plunged later in the year.
The bull market's wall of worry was highlighted in last week's USA Today article and many of the key points I have highlighted on the chart. At the end of May 2009 the monthly A/D line moved back above its WMA (point 2) confirming a new bull market. The weekly A/D line had turned positive in early April of 2009.
Throughout the bull market Greece's debt problem and the possibility the Euro zone would break up have consistently scared investors out of stocks. The first warning came in the summer of 2010 and then again in the early fall of 2011, after US debt was downgraded. This Yahoo Finance article detailed why a Euro zone failure was imminent. In both instances the daily A/D lines identified the correction lows.
The May 2012 drop was spurred on by Facebook's IPO failure and more fears over Greece. The S&P 500 just dropped back to its 20-month WMA before the market resumed its rally. There were clear signs from the market internals in early June (Rally Potential That Bears Don't Expect) that the market's decline was over.
The stock market rally continued in 2013 and 2014 despite many warnings that the bull market was ending. In fact many of today's perpetually bearish market analysts have been negative since 2013. In the fall of 2014 I was speaking at a conference where a doctor turned analyst warned that the Ebola outbreak signaled a major market top. As it turned out the market bottomed just a few days later.
The monthly NYSE A/D line dropped below its WMA in August 2015 (line 3) for the first time in sixty months. Neither the weekly nor the monthly A/D lines had formed any significant divergences so this turn was consistent with a correction not a bull market top. There were also no signs of an imminent recession.
By March of 2016 the monthly A/D line had moved back above its WMA (line 4) which confirmed the bullish action of the weekly A/D lines in February (Is There Blood In The Streets Yet?) By the end of May the A/D line had made new all time highs which I pointed out then was a major bullish signal for stocks.
My analysis of the daily, weekly and monthly advance/decline lines is a regular part of my blog posts as well as the Viper ETF and Viper Hot Stocks Reports. If you have found that you are often selling stocks at market lows or buying near tops following the A/D lines should be a regular part of your market analysis.
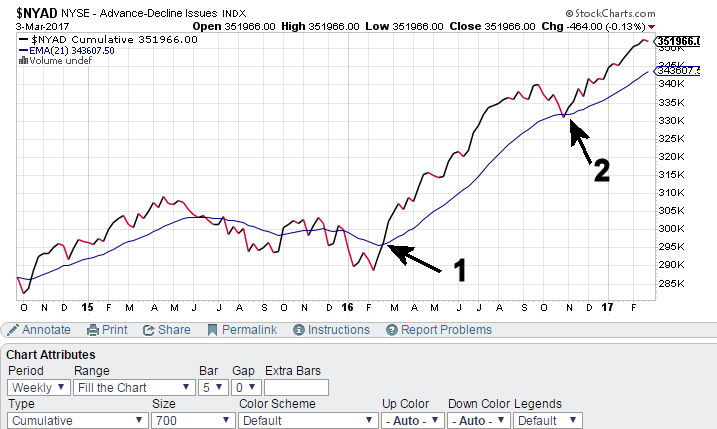
The best free site I have found for data on the NYSE advance/decline line is at stockcharts.com. The chart above of $NYAD includes a 21 period EMA. The $NYAD crossed above its WMA in February of 2016 (point 1) while in October the $NYAD line just dropped down to test it's WMA, point 2, before turning higher.
The new all time high by the A/D line in late November was a strong reason to be buying stocks on a correction or a period of consolidation. This was one of the factors why I was so convinced in December and January that stocks were going to move even higher. I urge you to start following the A/D lines at least on a weekly basis as it will keep you riding the bull market until it is over.
The Economy
Friday's comments by Federal Reserve Chair Janet Yellen almost guaranteed a rate hike at the March 14-15th meeting and acknowledged the continued improvement in the economy I have been discussing over the past several months.
The economic data last week gave more encouragement for investors to buy stocks. While the GDP data Tuesday was a bit weaker than expected the Chicago PMI at 57.4 was stronger than the consensus forecast of 53.
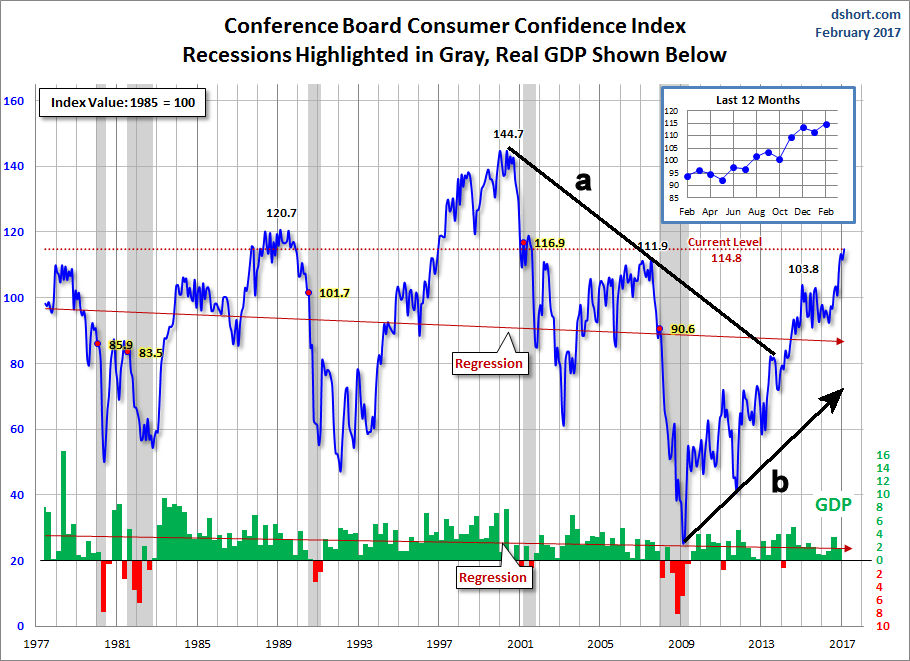
Tuesday's February Consumer Confidence at 114.8 was the highest reading since 2001. I have added the annotation to Doug Short's excellent chart which shows the break of the downtrend, line a, in 2014. I discussed this positive development at the time as it confirmed the strong uptrend, line b. It indicates a positive economic outlook for the months ahead.
Both the ISM Manufacturing Index and the ISM Non-manufacturing indices beat expectations last week as they exceeded the prior month's readings.
This week we have Factory Orders on Monday with the ADP Employment Report on Wednesday. The monthly jobs report will be released on Friday.
Interest Rates & Commodities
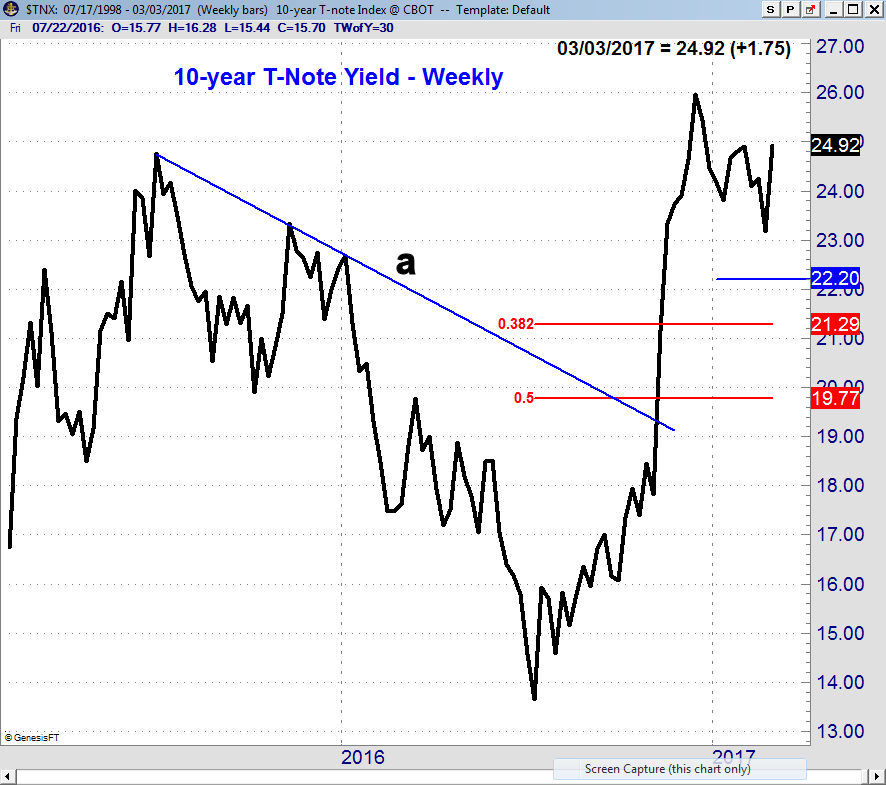
The yield on the 10-year T-Note reversed sharply last week as it closed at 2.492% up from 2.317% the previous week. The weekly close only chart suggests that the pullback in yields from the December highs is now over. A daily close in yields above 2.540% would be further confirmation and yields peaked in December at 2.596%.
Crude oil was a bit lower last week but is still locked in its six-week range. Even crude oil typically bottoms in February the technical studies have not yet signaled that it is ready to breakout to the upside.
Gold reversed to the downside on the prospect of higher yields. The weekly studies are positive on the futures but have turned down so the extent of the pullback will be important.
Market Wrap
Even though the market surged impressively on Wednesday the weekly gains in the major indices were not that dramatic as the Russell 2000 was down a fraction for the week. The Dow Industrials gained 0.88% with the S&P 500 up 0.67%. The Nasdaq Composite and Nasdaq 100 lagged gaining 0.44%. For the week the declines led the advances by a 1652 to 1438 margin. The NYSE stocks making new highs did surge last week and supported the new market highs.
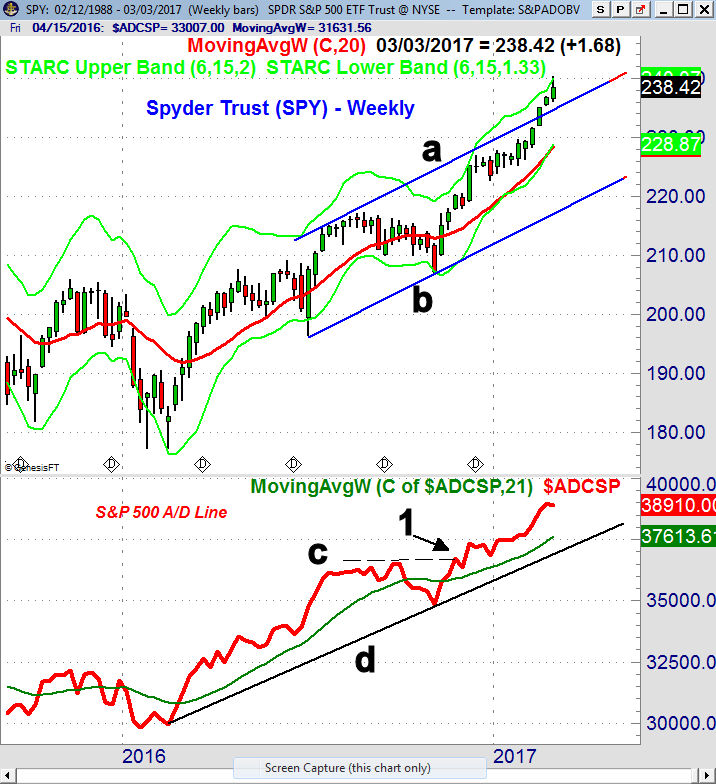
The Spyder Trust (SPY) exceeded its weekly starc+ band last week and the quarterly pivot resistance at $240.04 as the high was $240.32. The daily starc+ band is at $240.72 with the March pivot resistance at $244.02. The 20-day EMA is now at $234.79 with the monthly pivot at $233.53.
The weekly S&P 500 A/D line was a bit lower last week but is well above its strongly rising WMA and support at line d. The weekly A/D broke out to the upside in December, point 1, as it made a new high and the resistance at line c, was overcome.
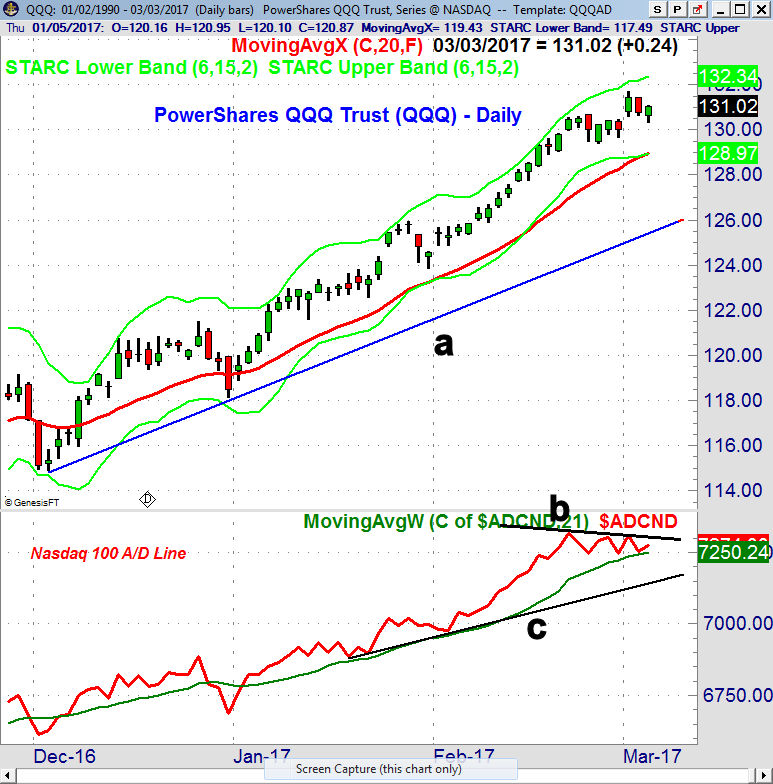
The PowerShares QQQ Trust (QQQ) pulled back late in the week but held above the support in the $130 area. The daily starc+ band is at $132.34 with the monthly pivot resistance at $134.37. The 20-day EMA and the daily starc- band are now in the $128.97 area with the March pivot at $128.53. The chart support from the December-January lows is in the $125-$126 area.
The Nasdaq 100 A/D line peaked on February 21st and has since formed slightly lower highs, line b. It has turned up from its WMA but could drop below it with negative A/D numbers early in this week. The A/D line support is well below current levels at line c.
The weekly Russell 2000 A/D line is now closer to its WMA and with IWM closing well below the weeks highs it is looking more vulnerable over the near term.
What to do? The upward explosion last week may have taken up too much of the buying power on a short-term basis. A further correction of say 1-2% would just take SPY band to its rising EMA and the monthly pivot.
This should be a good buying opportunity as the next rally is likely to push the market to further new highs. The bullish intermediate term trend is based on the weekly A/D analysis which has not yet generated any warning signals.
Viper ETF traders took partial profits in the SPY on Wednesday and will look to take more trading profits on strength. Investors are sticking with positions until there are more serious warnings from the daily and weekly A/D lines.
A daily correction should be an opportunity for those who are not invested to do some lightly buying in a low cost broadly diversified ETF.
For those interested in trading stocks might consider the Viper Hot Stocks Report . Both the 4-5 page ETF and Stock reports are sent out twice a week and each report is only $34.95 each per month. New subscribers also receive the five most recent Trading Lessons. Subscriptions can be cancelled on line at any time.
Comments
comments