

February 14, 2021: It was another strong weekly close for the stock market. The S&P 500 rallied sharply in the last hour of trading despite some traders' concerns about changes in market sentiment over the long weekend. However, the declining COVID-19 cases in the U.S. and the announced purchase of 200 million additional vaccine doses seem to have kept the market tone optimistic.

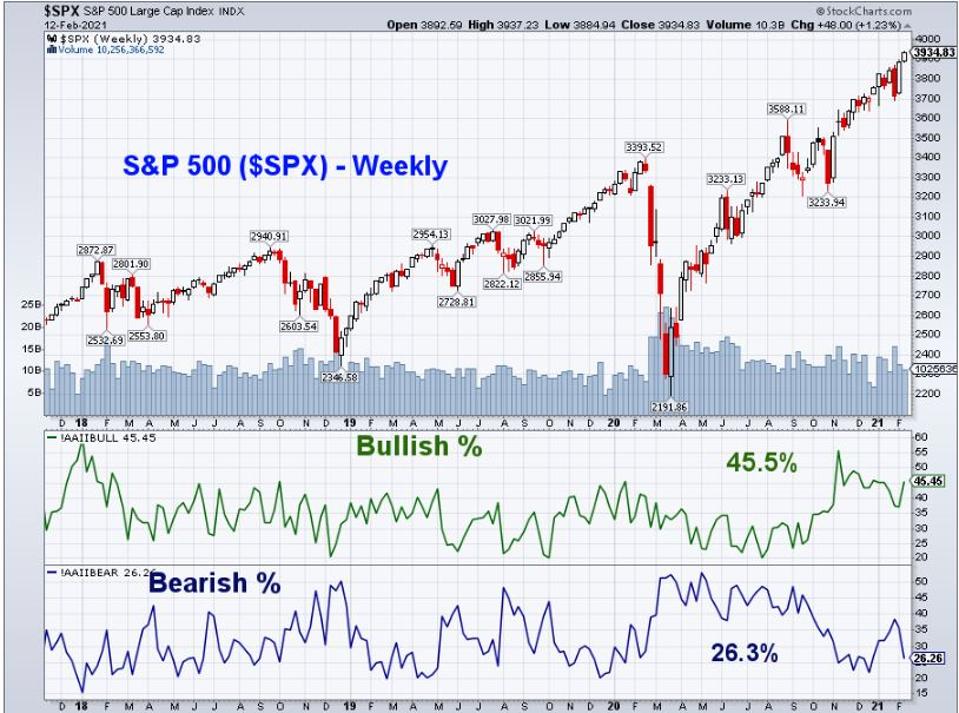
In last week’s survey by the American Association of Individual Investors (AAII), the Bearish %, dropped 10.1 points to 26.3%, down from 36.6% a week ago. The Bullish % rose 8.1 points to 45.4%. That is the highest reading so far in 2021, as the Bullish % may be ready to challenge the November 11, 2020 reading of 55.8%.
In my experience, a low Bullish % reading is a better indication of a market low than a high Bullish % reading is of a market top. Still, a move in the Bullish % above 50% would still be noteworthy, and cause for concern.
A recent review of January’s Bank of America BAC manager survey revealed some high bullish readings similar to those in January 2018. It is interesting to note that in 2018, the Bullish % peaked at 59.7% on January 3, and the stock market rallied for another three weeks before it dropping sharply.

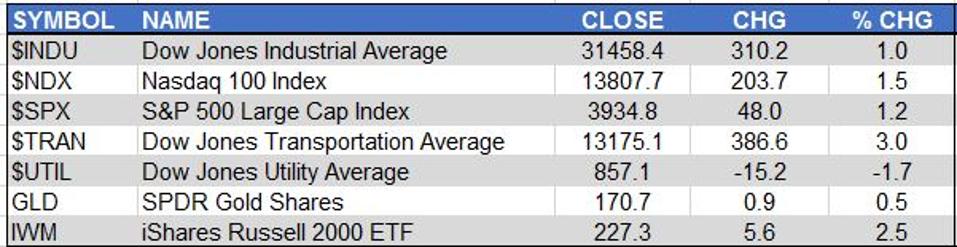
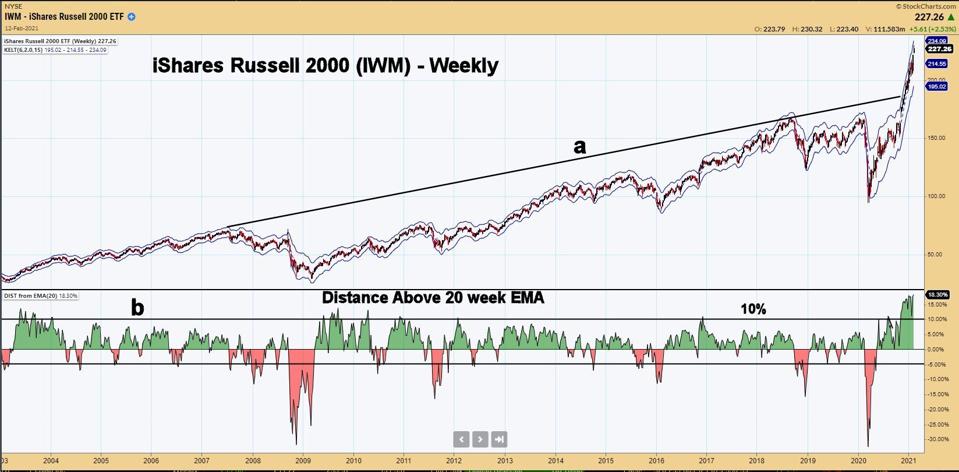
It was another strong week for the Dow Jones Transportation Average ($TRAN), which was up 3%, just a bit better than the 2.5% gain by the iShares Russell 2000 (IWM)IWM. The Nasdaq 100 Index, S&P 500 and Dow Jones Industrial Average were all up over 1%. The Dow Jones Utility Average was hit hard, as it lost 1.7%.

The iShares Russell 2000 (IWM) moved above long term resistance going back to 2007 (line a) in December. IWM has been very extended on the upside. As I have noted previously, it has moved above its weekly starc+ band a number of times in the last few months.
Another way to determine when a market has reached a price extreme is to look at how far it is above or below its 20-period exponential moving average (EMA). The current reading is 18.3%, which means that IWM closed last week that far above its 20-week EMA. The horizontal line (line b) is drawn at 10%. In the rallies after the 2003 and 2009 bear market lows, the percentage peaked around 13.8%.
The stock market didn't seem to react to the mid-month reading on Consumer Sentiment which came in at 76.2, weaker than the expected 80.8. Richard Curtin, Director of the University of Michigan's Surveys of Consumers, commented that “the entire loss concentrated in the Expectation Index and among households with incomes below $75,000. Households with incomes in the bottom third reported significant setbacks in their current finances.”

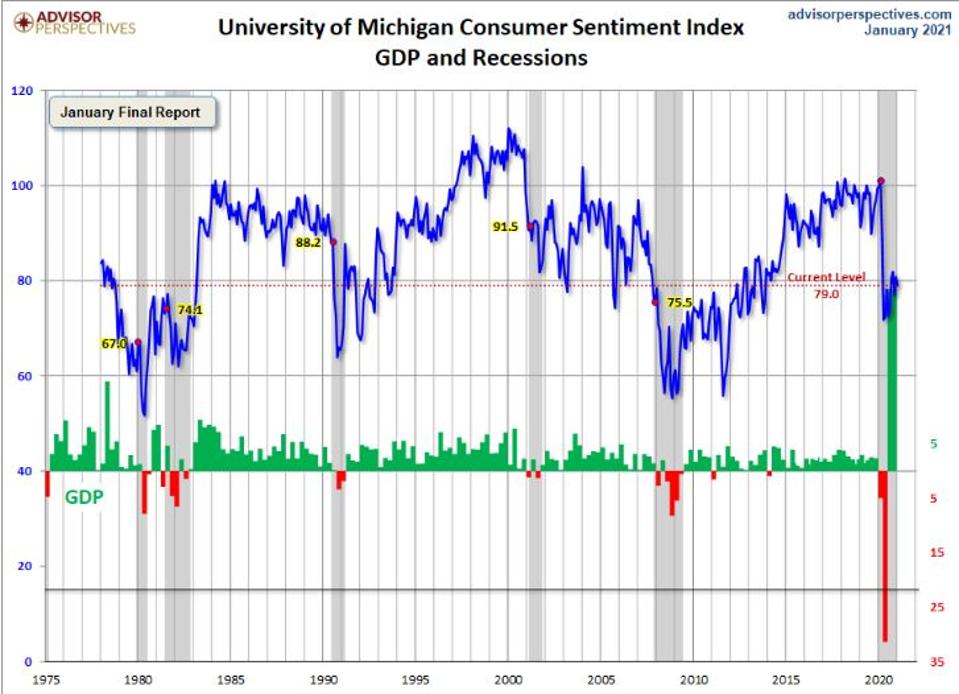
This is the mid-month reading, and the final February reading does not come until February 26. The final reading for January was 79. Consumer spending is estimated to make up 70% of the U.S. GDP, so a more pessimistic outlook could have a detrimental impact on the economy. The long term chart from Advisor Perspectives shows that sentiment has dropped sharply at the start of past recessions. The Conference Board’s Consumer Confidence Index, another important measure of the consumer, will be released on February 23.

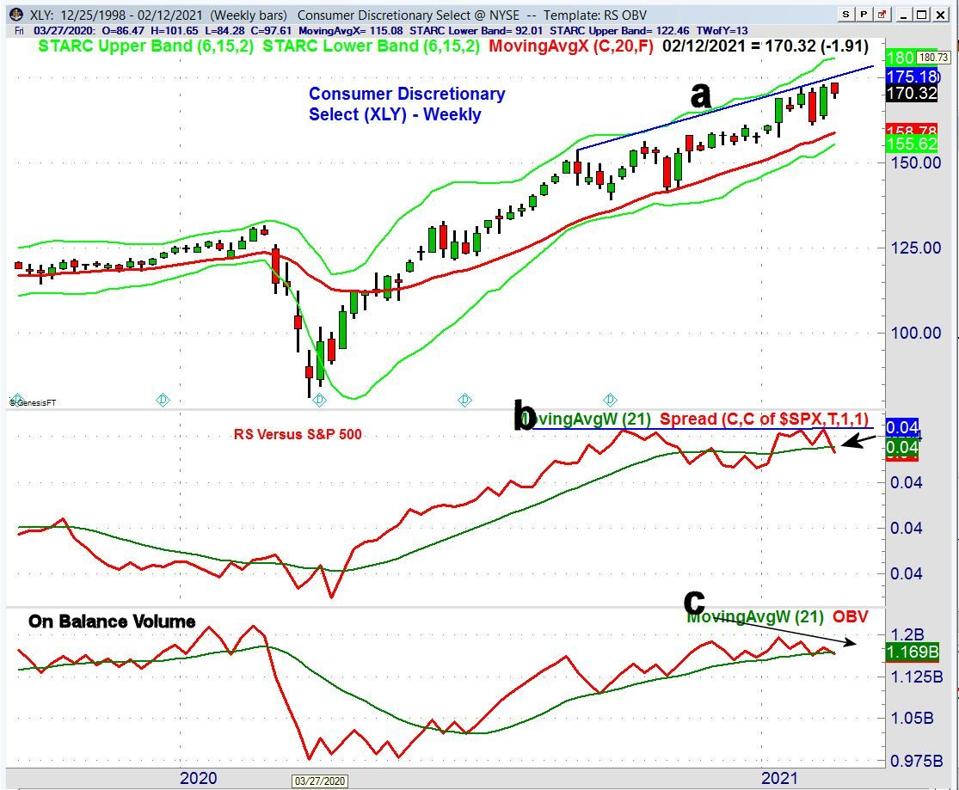
The Consumer Discretionary Select ETF (XLY)XLY diverged from the S&P 500 last week as it was down 1.1%, while the S&P 500 was up 1.2%. The weekly chart shows a pattern of higher highs (line a), with its weekly starc+ band at $180.80. The rising 20-week EMA is at $158.78, which is 6.4% below Friday’s close.
The relative performance (RS) has not formed new highs with prices (line b). This means that XLY has not recently been stronger than the S&P 500. The RS dropped below its weighted moving average (WMA) last week, suggesting that it will continue to be weaker than the S&P 500. The On Balance Volume (OBV) has also been diverging from prices since early in the year, (line c), and has closed fractionally below its WMA.

On the NYSE last week there were 2117 issues advancing and just 1171 issues declining. These were strong numbers that supported the market gains.
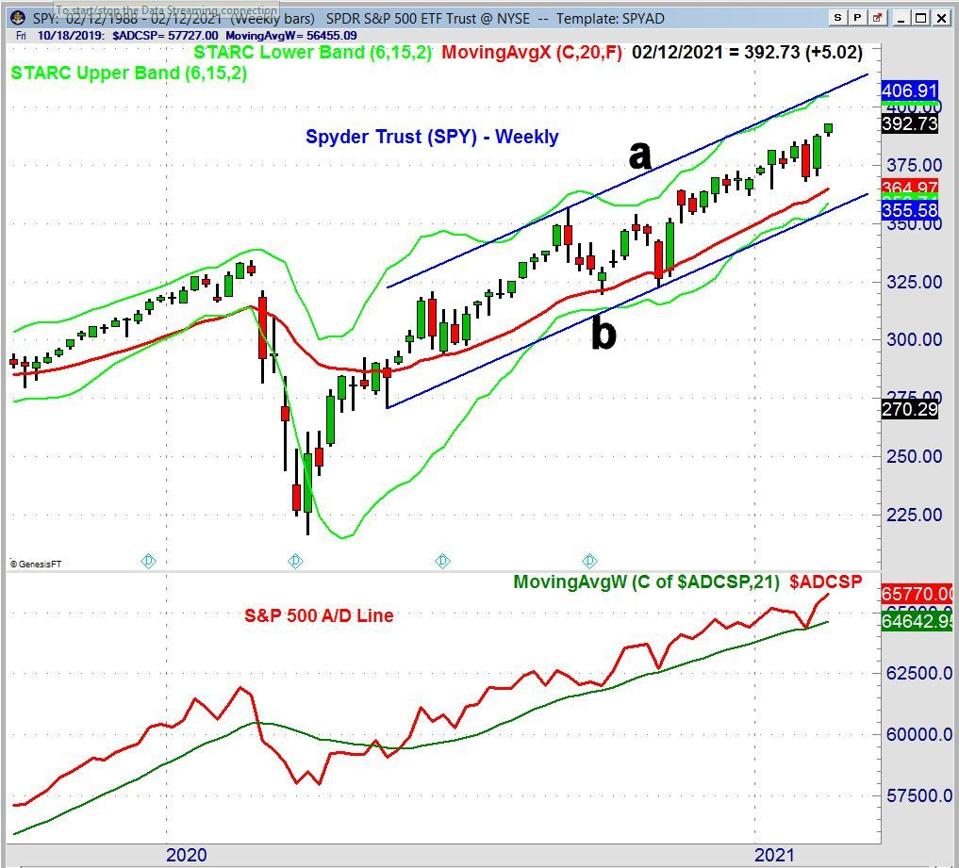
The weekly chart of the Spyder Trust (SPY) SPY shows a trading channel with the upper boundary (line a) at $404.71, which is 3.1% above Friday’s close. The rising 20-week EMA is at $364.97, which is 7% below last week’s close. In the past year, this measure of support has been approached on three occasions.
The weekly S&P 500 Advance/Decline line made another new high last week after dropping down to its WMA at the end of January. The daily S&P 500 A/D line (not shown) turned sharply higher late in the week.
There is a full economic calendar this week, which includes the Producer Price Index, Empire State Manufacturing Index, Retail Sales, Industrial Production and the Philadelphia Fed Manufacturing Index. The yield on the 10 Year T-Note closed on the week’s high at 1.20%, and further signs of a rebounding economy may move rates even higher. So far, investors do not seem concerned about rising rates, but if they start rising more sharply, that may change.
In my Viper ETF Report and Viper Hot Stocks Report, I update subscribers with market analysis twice per week, along with specific buy and sell advice. Each report is just $34.95 per month. New subscribers also receive six free trading lessons, a $49 value.
If you are interested in a unique opportunity for one-on-one training with Tom Aspray, you can find out more information at this link or email us at WentworthResearch@com
Comments
comments