
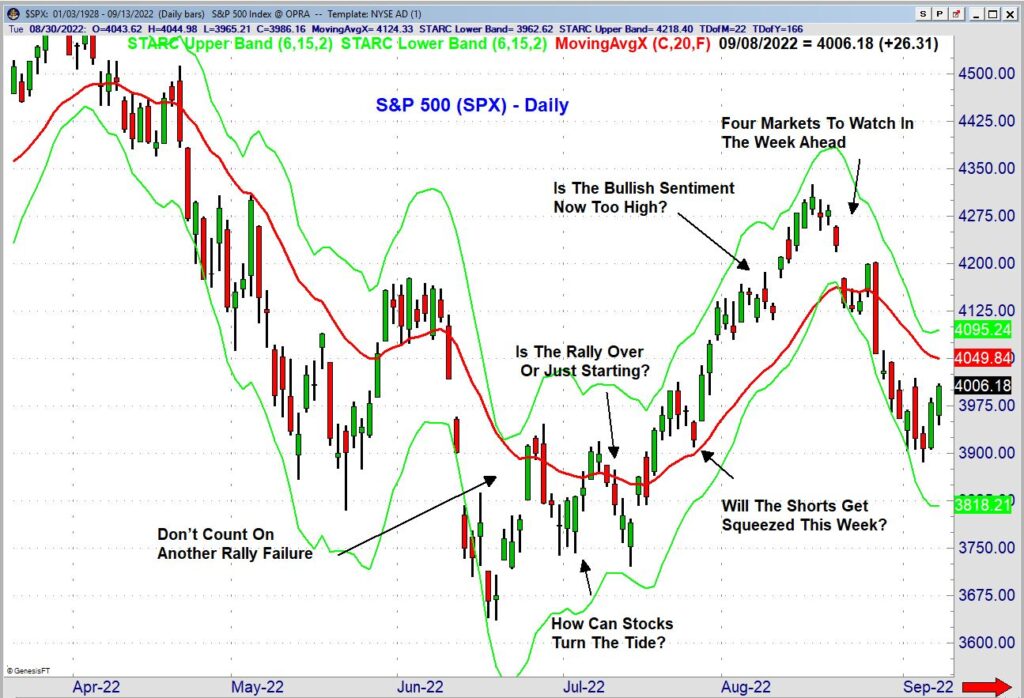
Don’t Count On Another Rally Failure - Jun 26, 2022, 05:46pm EDT
The buyers finally took over the stock market last week as the S&P 500 recorded gains of 2.45% Tuesday, 0.95% Thursday, and 3.06% on Friday. From a technical standpoint there was improvement in the futures on Monday. Given the failing sharp rebounds so far in 2022 many are not expecting the stock market to continue higher as some are looking for more investor pain in the second half of 2022.
I have been looking for a more sustainable market rally for some time especially after the selling climaxes just before the May lows. There were several indications from both a technical and sentiment standpoint that the market was near a low. Instead, the market was hit with another wave of heavy selling in June that dropped the averages to convincing new lows.
In last week’s survey from the American Association of Individual Investors (AAII), only 18.2% of those surveyed expect stock prices to be higher in the next six months. It also revealed that 59.3% of investors are bearish as they expect prices to be lower in the next six months.
This is one of several contrary indicators that continue to show extreme readings. When there are too few bullish investors or too many bearish investors the stock market is historically likely to move higher not lower.
When hedge funds and large money managers have a relatively high level of cash it is often a good time to buy. In the May BofA survey, those who manage just under $1 trillion have the highest cash levels since September 2001. From the lows that month, the S&P 500 began a 15-week rally that took the index 24% higher. Such a rally now would certainly change the market sentiment dramatically.

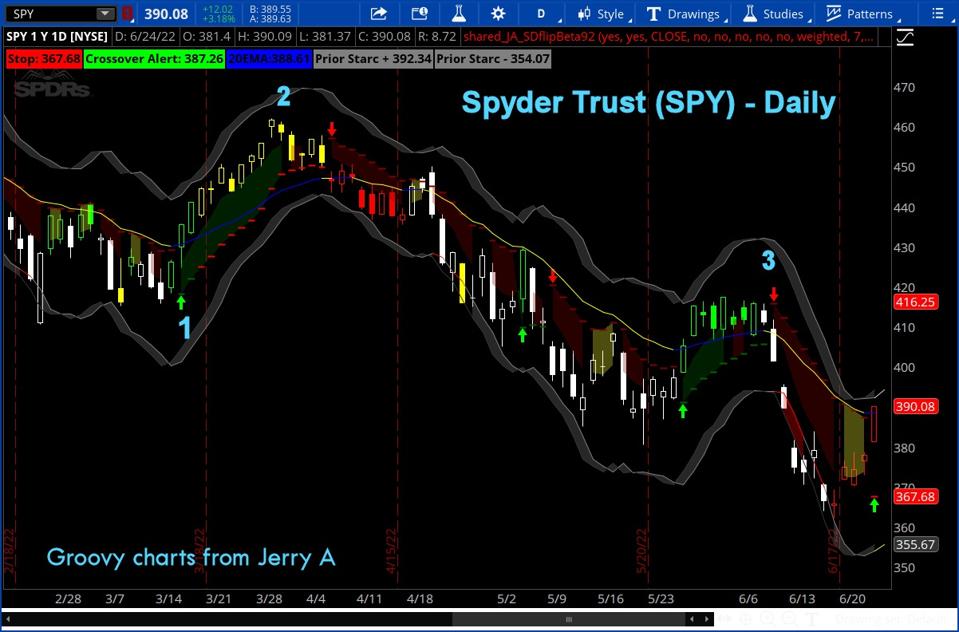
Of course, these contrarian measures have been sending warning signals since March but other than the rally from March 15th (point 1) through March 29th (point 2) the rallies in April and early May were brief. There was a better rally from the May 20th low that ended with the downside reversal on June 9th, point 3. The analysis on the SPYPYSPY as well as the S&P futures analysis both turned positive on Friday, June 24th.

So after last week’s impressive gains how much higher can the averages go? Also is this just a bear market rally or could it be the start of a longer-lasting move to the upside?
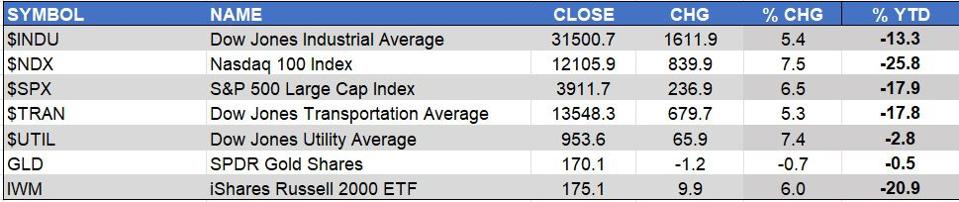
The Nasdaq 100 ($NDX) was the week’s top gainer up 7.4% barely outpacing the 7.4% gain in the Dow Jones Utility Average. The $NDX is still down 25.8% year-to-date (YTD) and is still the weakest of these markets.
The widely watched S&P 500 was up 6.5% with the iShares Russell 2000 gaining 6% and the Dow Jones Industrials not far behind as it rose 5.4%. The market internals were over 10-1 positive early Friday and on the NYSE for the week there were 2646 issues advancing and 847 declining.

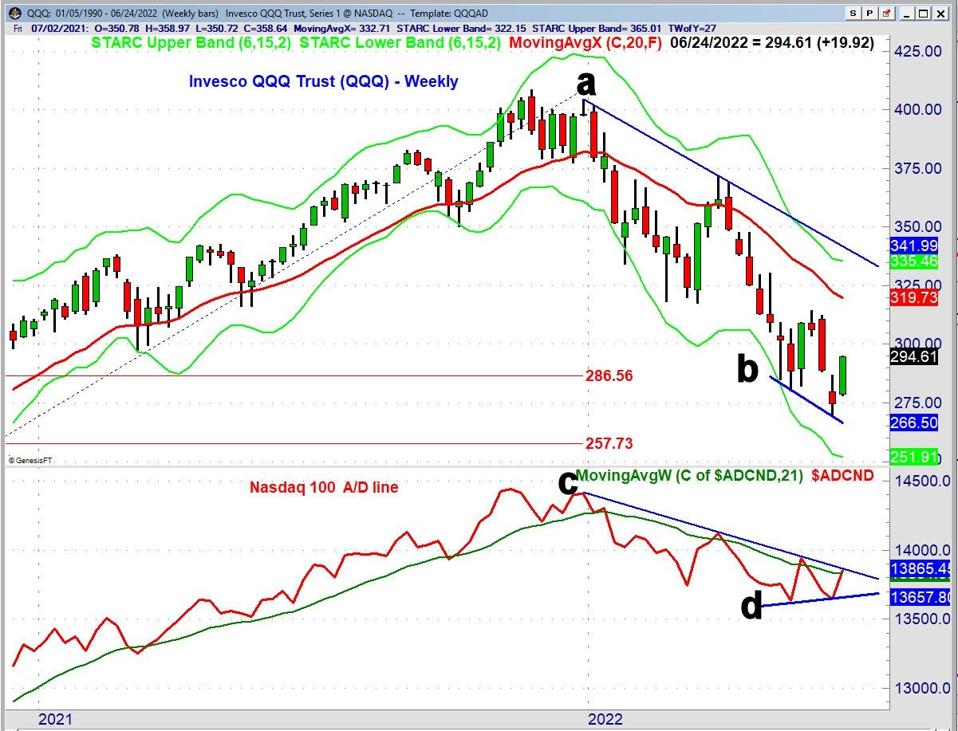
The weekly chart of the Invesco QQQQQQ Trust (QQQ) which tracks the $NDX, closed above its 20-day EMA but is still 8.4% below its declining 20-week EMA at $319.73. This is the area that some will be looking at for a failing rally but the weekly downtrend, line a, is at $341.99. This is just above the 50% retracement resistance from the November 2021 high.
As QQQ made lower lows, line b, the weekly Nasdaq 100 Advance/Decline line formed higher lows, line d. Since data was first available in 2009 it has never formed such a bullish divergence. A move in the A/D line above the May high will confirm the divergence. Similar formations in the NYSE All A/D line have corresponded to important market turns which raises the possibility that an important low may have been formed last week.
It is way too early to be planning for a major low and the market will need to be watched closely for signs the rally has fizzled. All of the daily A/D lines are positive but a higher weekly close is needed this week to further support the positive technical outlook.
Stock traders should try the Viper Hot Stocks Report

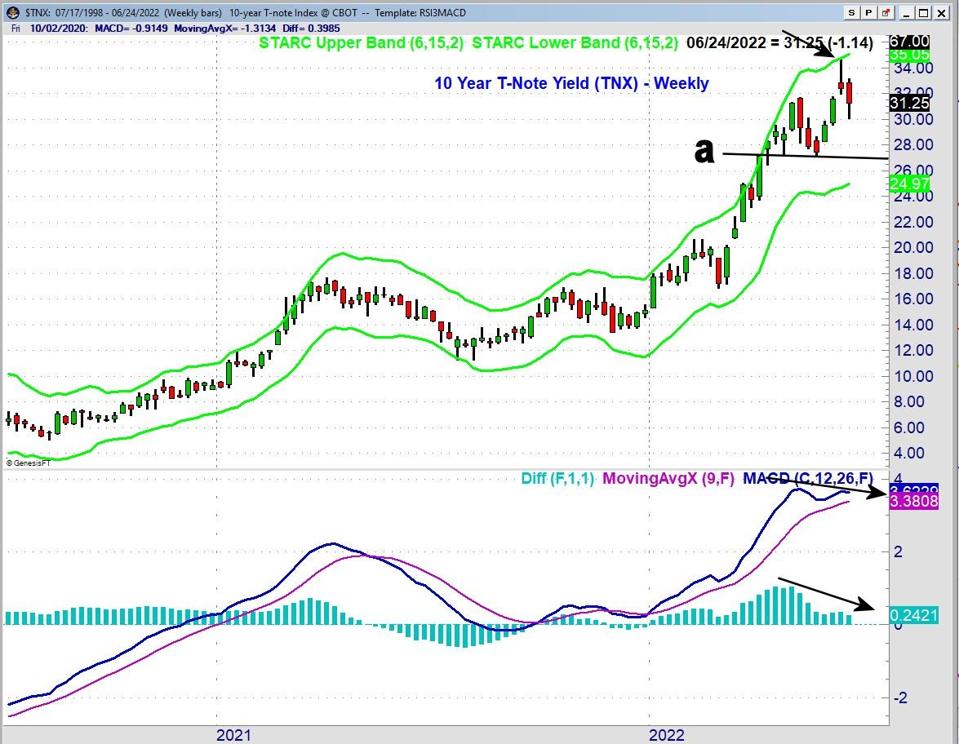
For the past few weeks, I have noticed signs that the yield on the 10 Year T-Note was topping out. Last week’s action supports this view as the prior week's yield had a high of 3.473 % and moved above the weekly starc+ band. The yield declined further last week and a drop below the May low of 2.708%, line a, will complete the top formation.
The weekly MACD and MACD-His have formed lower highs or negative divergences which is consistent with a top in yields. The daily MACDS are negative and also formed bearish divergence at the recent highs. Lower yields should be supportive for stocks and could reduce some of the inflationary fears.

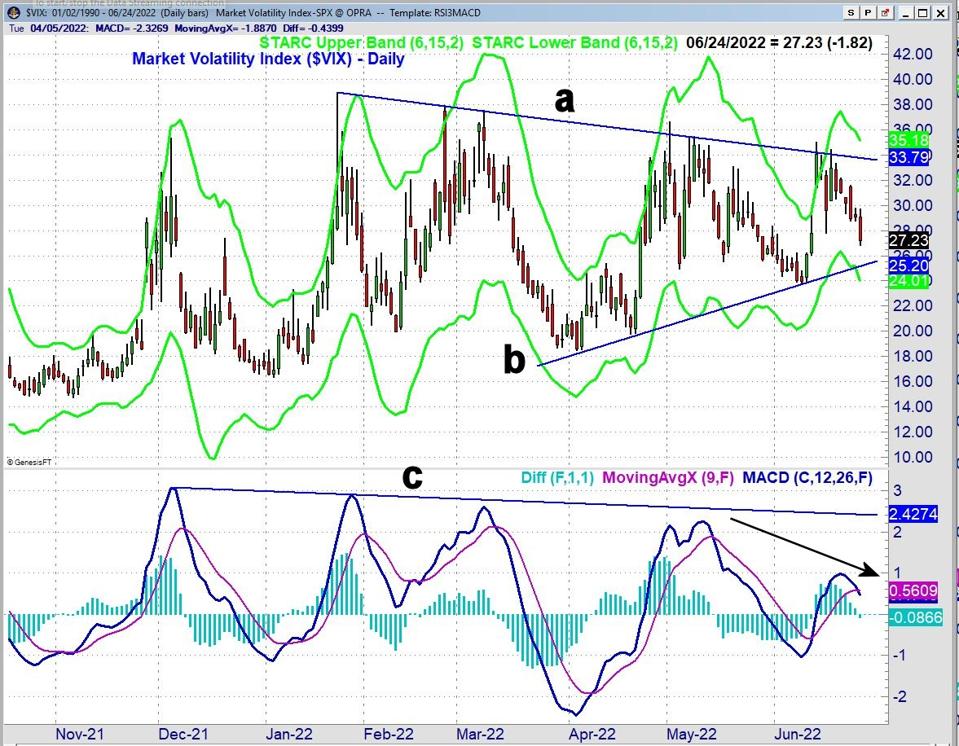
The daily chart of the Market Volatility Index ($VIX) has formed a series of lower highs, line a, since the start of the year. This is in contrast to the lower lows in the market averages. Often times in a strong market decline the VIX will form consistently higher highs. The VIX now looks ready to break the support at line b. This would indicate a drop to the 20 area.
The MACDs has formed lower highs like BitcoinBTC did before its recent plunge. Both MACDs turned negative on Friday which should also be supportive for stocks in the weeks ahead. Those who used VIX options to hedge their portfolio during the market's decline are likely to be disappointed again.
Three sectors, Consumer Discretionary (XLYXLY), Health Care Select and Real Estate Sector (XLREXLRE) were up 8% or more last week. The volume in the sector ETFs has not been as impressive as it was in some of the stocks.

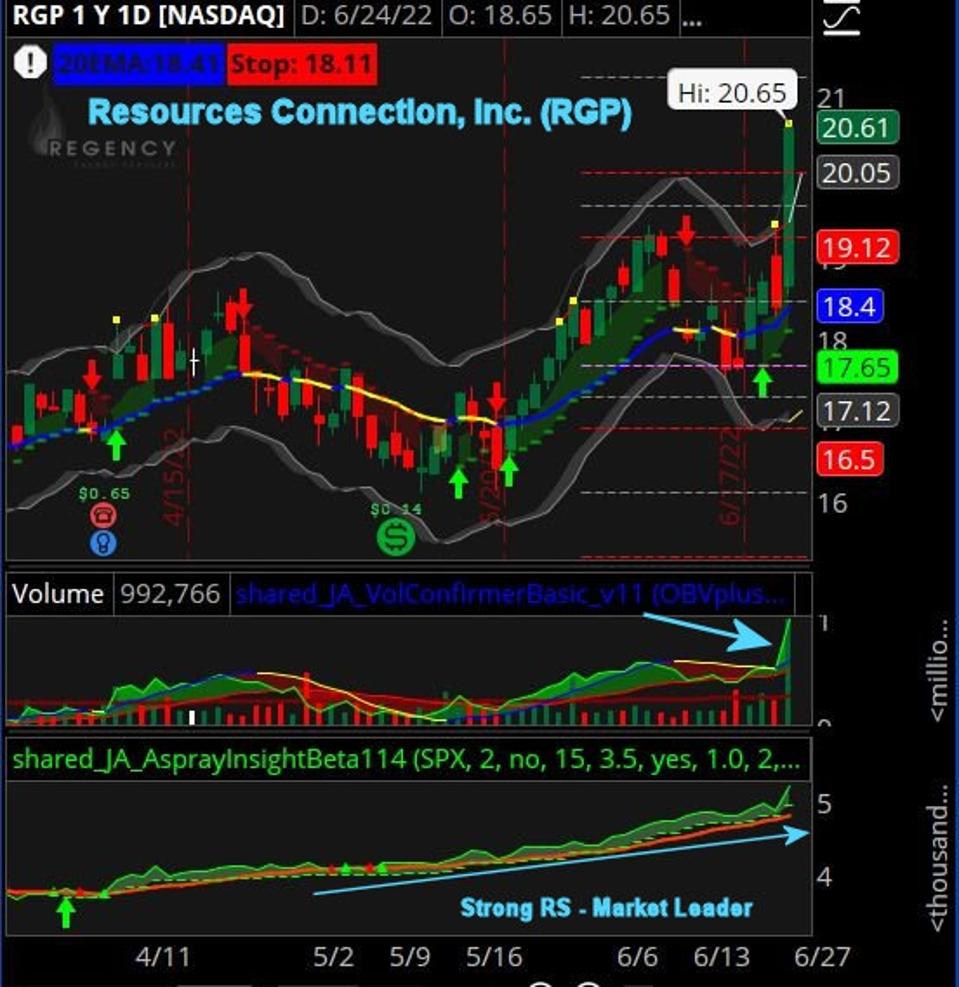
Resource Connection (RGP) showed up on my daily scan after Wednesday’s close and it was up 12% Friday with four times the average volume. The relative performance analysis shows that it has been a market leader since early May. In fact, there were also stocks on my weekly scan that had record daily volume for the year in Friday’s trading.
It would not be surprising to see some light selling early in the week as many are not likely to trust Friday’s market action. For all new positions it is important to measure the risk on all new positions and until the A/D lines are trending higher would not be an aggressive buyer.
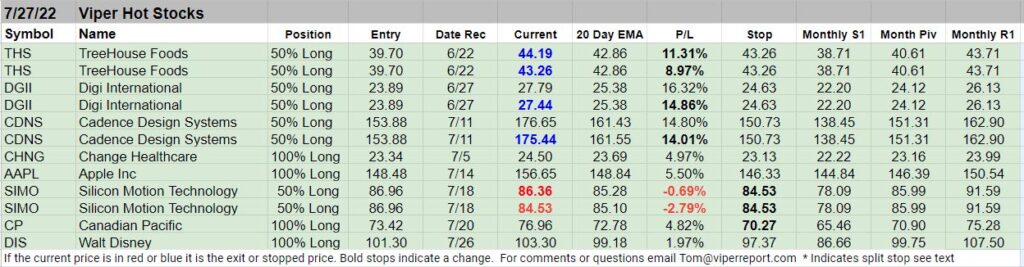
This table shows the Viper Hot Stocks positions that were bought before the 4th of July holiday

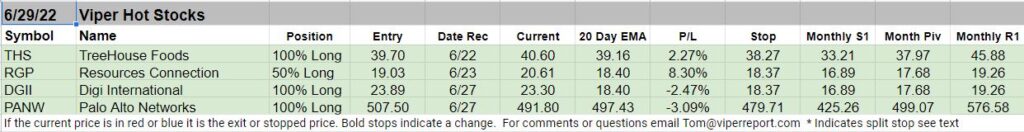
Fast Forward and you will see how these stocks were doing just a month later!! Subscribe Now

How Can Stocks Turn The Tide? Jul 4, 2022,04:33pm EDT
The stock market’s late rebound on Friday was accompanied by a drop in the 10 Year T-Note yield below the June lows. As pointed out last week (see chart) the technical indicators did suggest that yields had topped out. Earlier in the year, rising yields pressured the stock market but so far lower yields and lower crude have not had much of an impact.
I was looking for more positive action last week but the stock market now has to prove itself in the coming week. The strong close last Friday was not enough to turn the tide to positive. As discussed below it will take several days of strong advance/decline numbers and a move in the averages above the recent highs.

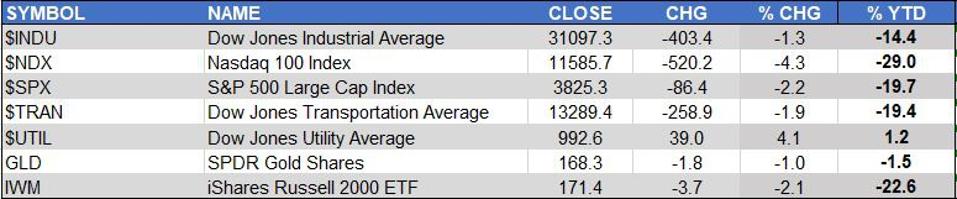
It was another rough week for the Nasdaq 100 as it dropped 4.3% which was almost twice the 2.2% decline in the S&P 500. The iShares Russell 2000 ETF (IWMIWM) was down 2.1% but in the past few weeks, it has started to act better technically.
The Dow Jones Utility Average was the only positive market gaining 4.1% in a likely reaction to falling yields which made its stocks more attractive. The other Dow Averages were lower for the week as the Dow Jones Transportation was down 1.9% while the Dow Jones Industrial Average lost 1.3%.
There are pretty dismal numbers in terms of year-to-date (YTD) performance as only the Dow Utility Average is higher YTD as it is up 1.2%. In contrast, the SPDR Gold Shares are down 1.5% YTD.
Last week I discussed the somewhat rare bullish divergence in the weekly Nasdaq 100 Advance/Decline Line where data is only available since early in the bull market. Last week there were more declining than advancing stocks on the Nasdaq 100. Therefore, the A/D line was lower as it dropped below its WMA but the bullish divergence is still intact. That could change if the numbers this week are negative while positive numbers are needed to increase the odds of a near term low.

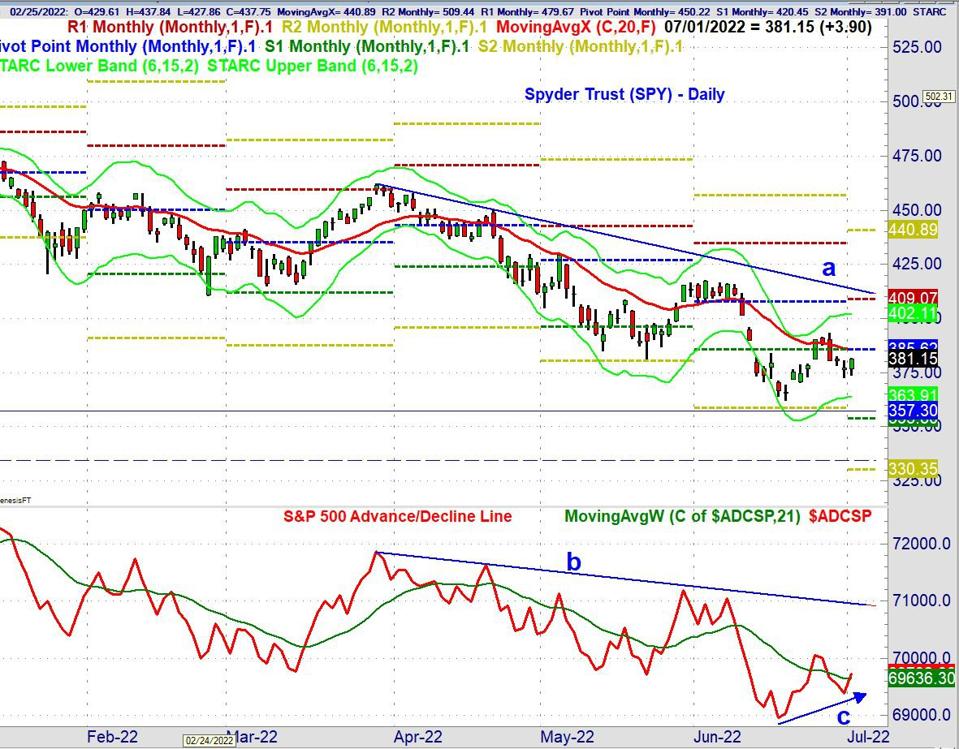
The Spyder Trust (SPYPYSPY) was up just over 1% on Friday but it closed below the July pivot at $385.62 and the 20 day EMA which is a bit lower. There is more important resistance at $393.16 which was last Tuesday’s high. The daily downtrend, line a, and the monthly R1 are in the $409.07 area. There is support at $363.01 and the daily starc- band.
The S&P 500 A/D line is in a short-term uptrend, line c, and closed Friday above its WMA. A strong move above the resistance at line b, is needed to signal a stronger rally. A drop below last week’s lows will indicate a further stock market decline.

Four sectors were higher last week led by the Utilities Sector Select (XLUXLU) which was up 4.1% while the Energy Select (XLEXLE) gained 1.4%. The Consumer Staples Select (XLPXLP) and Health Care Select (XLVXLV) had smaller gains of 0.5% and 0.4% respectively
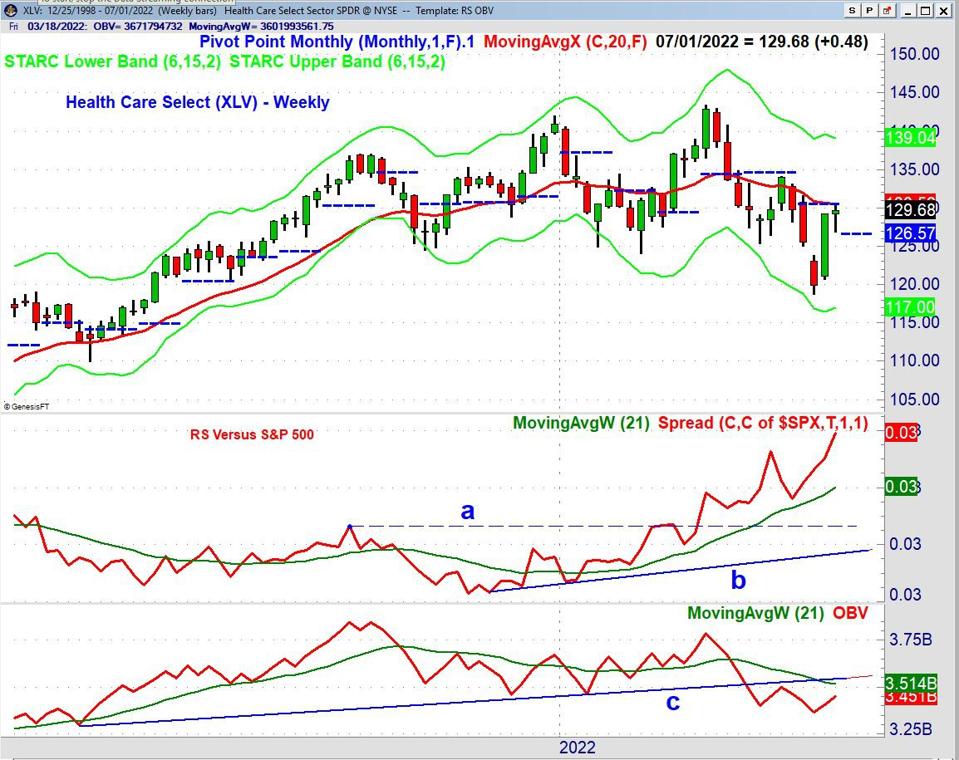
XLV was one of the sector ETFs that interested me at the start of the week and it was up 1.1% Friday to close at $129.68. That was just below the new QPivot at $130.46 and a weekly close above it would be a positive sign for the intermediate trend. The is further chart resistance at $133.47, the May high.
The weekly relative performance (RS) has surged to further new highs after overcoming resistance, line a, early in the year. This was a sign it was a market leader but it is important to remember that the RS analysis only tells you only how an ETF or stock is performing against the SPX. Positive RS analysis does not mean a market will not decline. For example, over the past three months, XLV was down 5.8% while $SPX was down 15.9%.
The weekly on-balance-volume (OBV) dropped below support, line c, in early MA and is still below its declining WMA. The close was well above the new monthly pivot at $126.57 and the rising 20 day EMA at $127.03 which should provide support. The daily indicators closed the week positive.

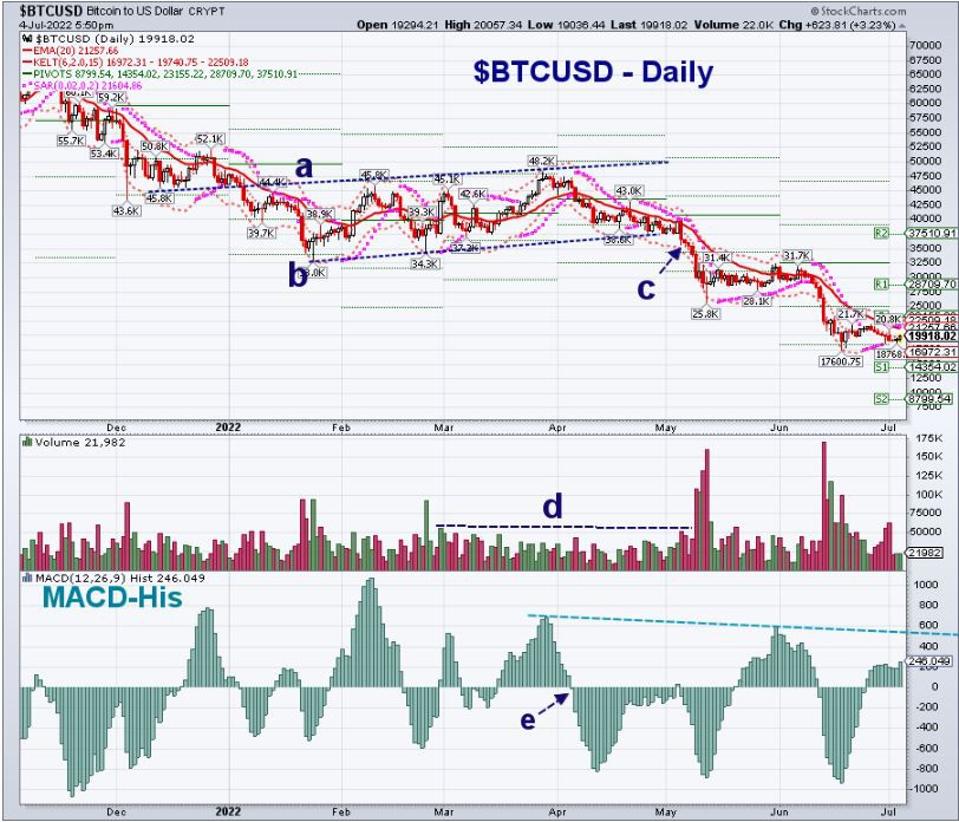
The decline in BitcoinBTC (BTC) has caused widespread financial pain in the past few months as it dropped to a low of $17,640 on June 18th. In early May I was focusing on the continuation pattern, line a and b, which I thought was just a pause in the downtrend. I commented that “a weekly close below $34,349 would be a sign that the downtrend had resumed”. That occurred on May 10th and the volume was heavy.
BTC then dropped to a low of $25,800 and then moved sideways until mid-June when there was another wave of selling. The daily MACD-His started to deteriorate in early June and then turned negative as BTC was dropping again. While the daily is positive but the weekly MACD-His is negative so the recent sideways pattern does not yet suggest a bottom is in place. I will try to do a full review of BTC before the middle of July
Follow me on Twitter for a Tuesday update on the stock market after the long weekend as the futures market action will be important heading into Tuesdays open.
For specific recommendations on ETFs – see the Viper ETF Report
Is The Rally Over Or Just Starting? - Jul 10, 2022,01:46pm EDT
This seems to be the debate amongst most traders with the next CPI report on Wednesday. The one-day $10 drop in the price of crude last week encouraged those who think inflation may have peaked. Many are wondering whether June’s data will also suggest a change in the inflationary trend.
Over the past few weeks, investors seem to be less concerned about inflation and more concerned about what many see as an unavoidable recession. Each week the economist’s odds of a recession seem to get higher as noted in a recent NY Times article JP Morgan Chase chief economist Bruce Kasman has “raised their expected probability of a recession in the next 12 months to an “uncomfortably high” 35 percent. “Others like Goldman Sachs have odds closer to 50%.
Of course, the official determination of a recession is based on the GDP and the forecasts for the second quarter GDP have also been lowered in the past few weeks to just barely positive. Given these negative headwinds, the positive action in the stock market was reassuring to some investors.

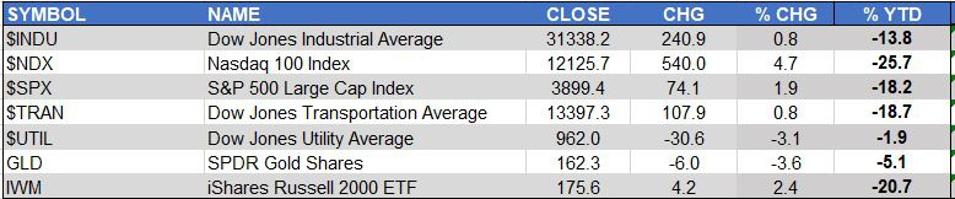
The Nasdaq 100 Index led the market higher gaining 4.7% but is still down 25.7% year-to-date. It was followed by the iShares Russell 2000 as it was up 2.4% followed by a 1.9% gain in the S&P 500.
It was still a mixed week as the Dow Jones Industrials were only up 0.8% as its components are likely to be hurt more by the strength in the US dollar. That also hurt gold which was down 3.6% and is now down 5.1% YTD. The Dow Utility Average was also lower, down 3.1% after a sharp gain the previous week.

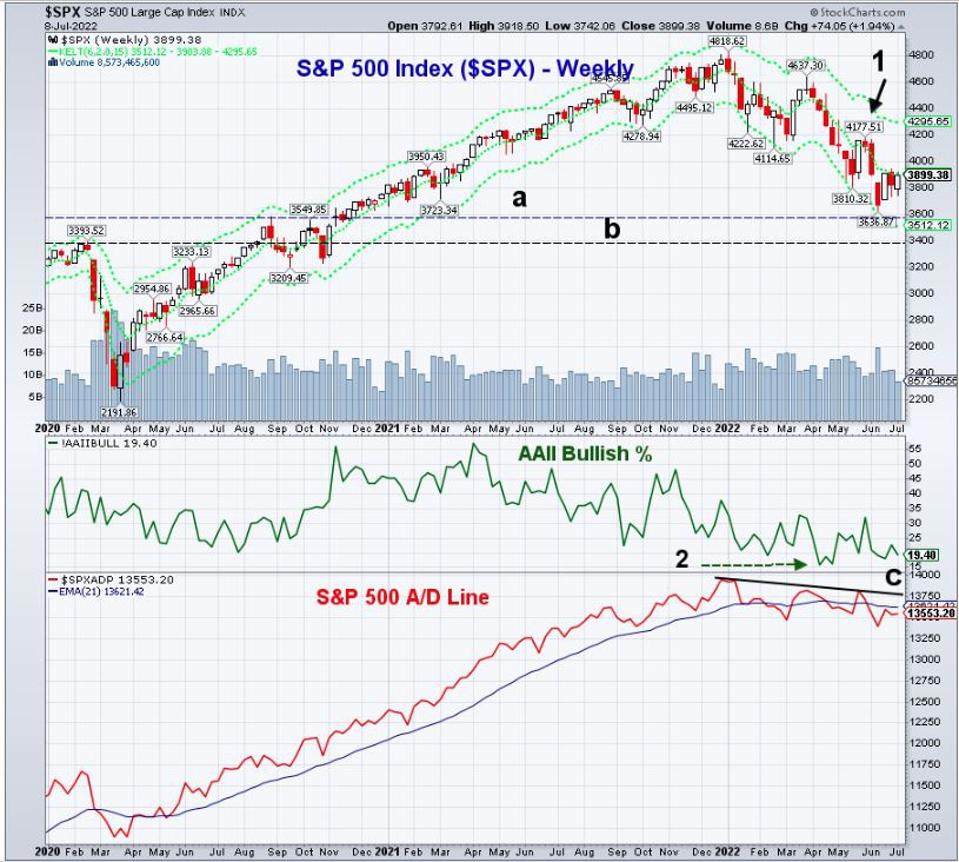
The weekly chart of the S&P 500 shows that it is still above the four-week low at 3636.87, line a. If this level is broken the next good support is at 3393.52, line b, which is a downside target for some bearish analysts.
A few of these analysts became even more negative last week and as they are looking for another 20% decline or more from current levels. They do not expect the S&P 500 to get much above 4050 before a further decline. A move above the May high at 4177.51, point 1, in my opinion, is needed to change the prevailing bearish sentiment.
The average investor, as polled by the American Association of Individual Investors (AAII), is not positive on the stock market for the next six months as the bullish % was 19.4%. Only this small percentage expect stock prices to be higher in six months while 52.8% are bearish and expect stocks to be lower.
According to Bespoke Investment, the four-week average of bulls-bears has been “below -10 (meaning on average bears have outnumbered bulls by at least 10 percentage points) for 23 straight weeks.” There was a stretch of 26 consecutive weeks which ended in February 1991. The April 14th reading of 15.8% (point 2) was the lowest reading since September of 1992.
The weekly S&P 500 Advance/Decline line is still below its WMA and is negative. The A/D line needs to move above the downtrend, line c, to signal that the market’s correction is over.

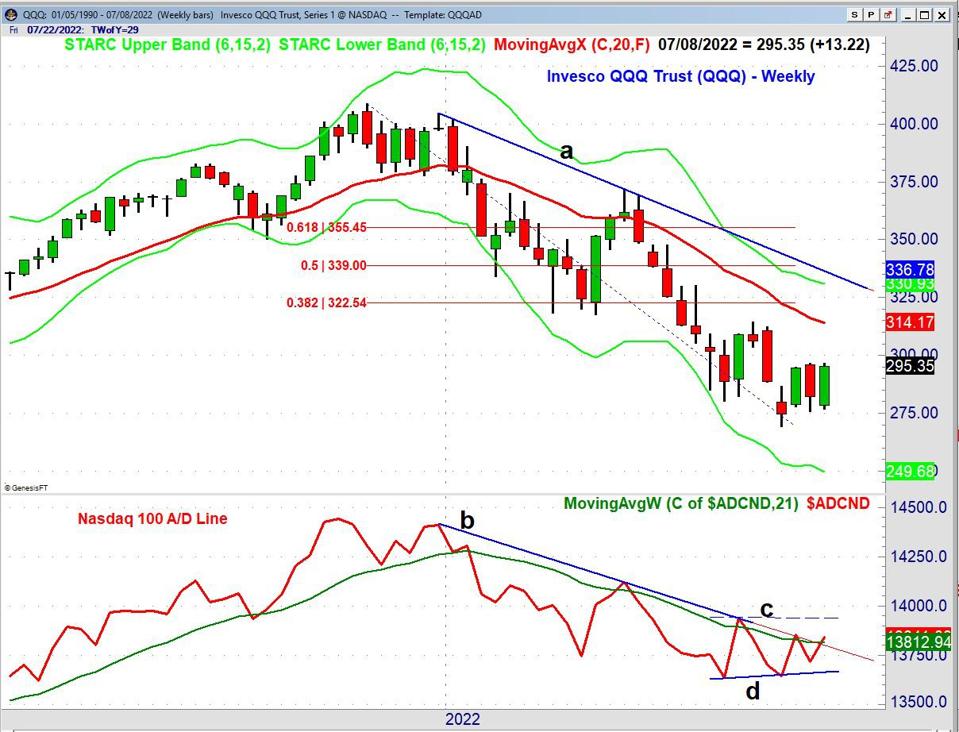
The weekly technical outlook for the Invesco QQQQQQ Trust (QQQ) does look more positive. For the last three weeks QQQ has been unable to move above $296.75 but if it is overcome the declining 20-week EMA is at $314.17. The 38.2% Fibonacci resistance level from the November 2021 high is at $322.54 with the downtrend, line a, at $336.78. The 50% resistance level is at $339.
The weekly bullish divergence (line d) in the Nasdaq 100 A/D line was pointed out two weeks ago (Don’t Count On Another Rally Failure) and it is still intact with last week’s close above the WMA. The A/D line now needs to overcome the resistance at line c, to confirm the divergence which would be a positive for the intermediate-term. The daily relative performance analysis (not shown) indicates that QQQ is starting to lead the SPYPYSPY which increases the odds of a further rally.

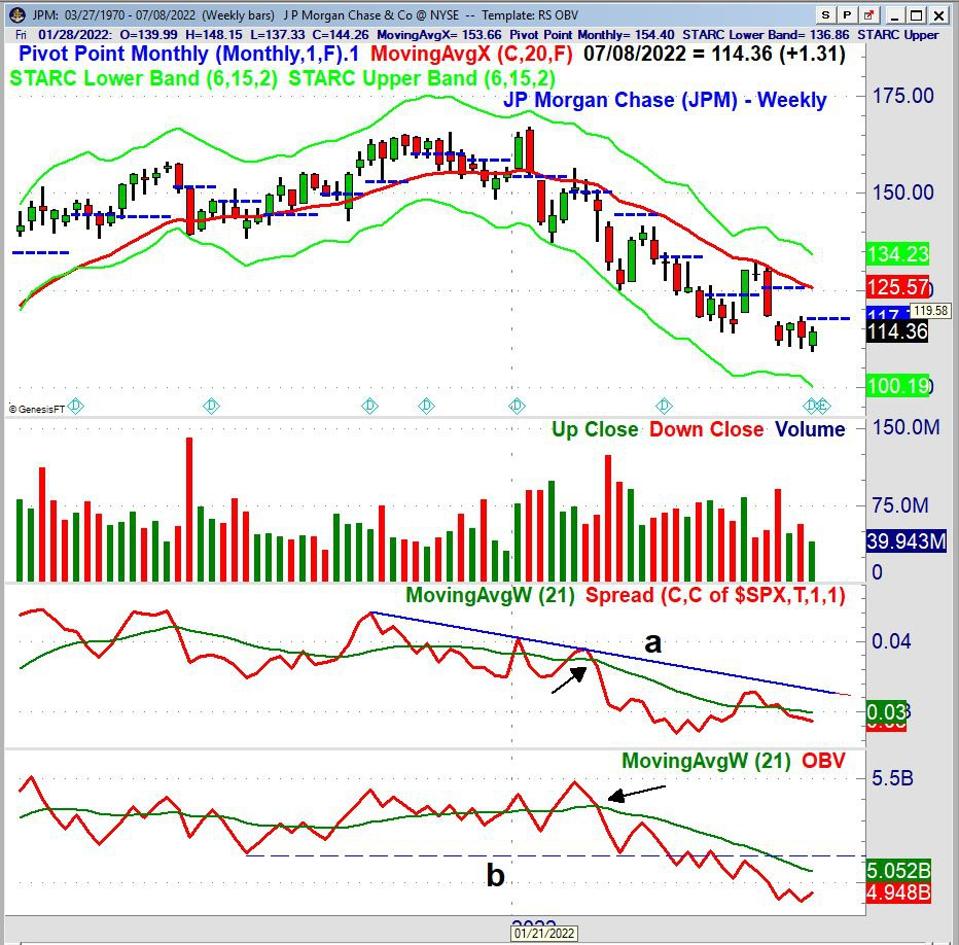
The wild card this week is the start of earnings season with JPMorgan ChaseJPM (JPM) and Morgan StanleyMS (MS) reporting on Thursday. The weekly chart of JPM still shows a well-established downtrend as it closed last week at $114.36 which was below the July pivot at $117.76. The 20-week EMA has been declining since early in the year and is now at $125.57.
The weekly relative performance diverged from prices at the all-time highs, line a, indicating JPM was not stronger than SPY. The RS is now back below its WMA. The on-balance-volume (OBV) has been leading prices lower since it dropped below support, line b, in April. Though JPM could still move higher on its earnings there are no signs of a change in the major trend.
A day or two of strong advance/decline numbers early in the week will support the bullish case which I continue to favor because of the positive action in the QQQ. The largest sustained market rallies occur when the daily A/D lines are trending higher which is not the case right now. Therefore one should continue to carefully analyze the risk of all new long positions.
Tom started telling Viper ETF traders to buy in mid - July and here are some of the ETFs he liked and how they were doing a month later as Tom was taking profits in ETFs like SMH

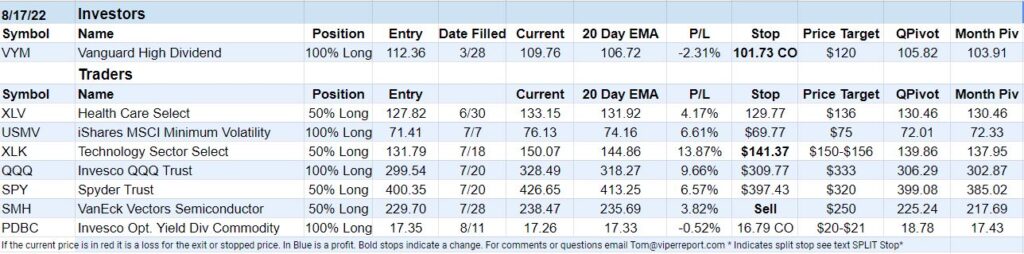
Stock traders should try the Viper ETF Report
Comments
comments