

Published March 20, 2022: Ever since the American Association of Individual Investors survey on February 16th reflected a bullish % of 19.2%, I have been cataloging the dramatic change in sentiment. This was evident in the raising of cash by large money managers and the decline to 30.30 in the National Association of Active Manager Exposure Index on March 2, 2021. These are all contrary indicators that reflect a low level of bullishness or a high level of bearishness that is needed for a market bottom.
The change in sentiment was forecast by the technical deterioration in late November when the number of Nasdaq New Lows spiked to 409 on November 19th. This confirmed the divergence between the Nasdaq Composite and the number of stocks making New Highs. The fact that the average stock was in trouble while the S&P 500 was making new highs was confirmed in the middle of January when the daily advance/decline lines turned solidly negative.
Since the New Lows spiked to 1755 on January 24th there has been some improvement as while the Nasdaq Composite has made new lows in late February and March fewer stocks have made New Lows (see chart). A rise in the number of Nasdaq New Highs above 160 would confirm this change in trend.
I started contributing to Forbes.com in 2011and many articles have focused on stock market sentiment. I have always stressed that one must wait for technical signals from the market internals before acting on extremes in sentiment. A good example was at the February 2016 lows when the bullish sentiment also dropped below 20% before the A/D lines turned positive (see chart).

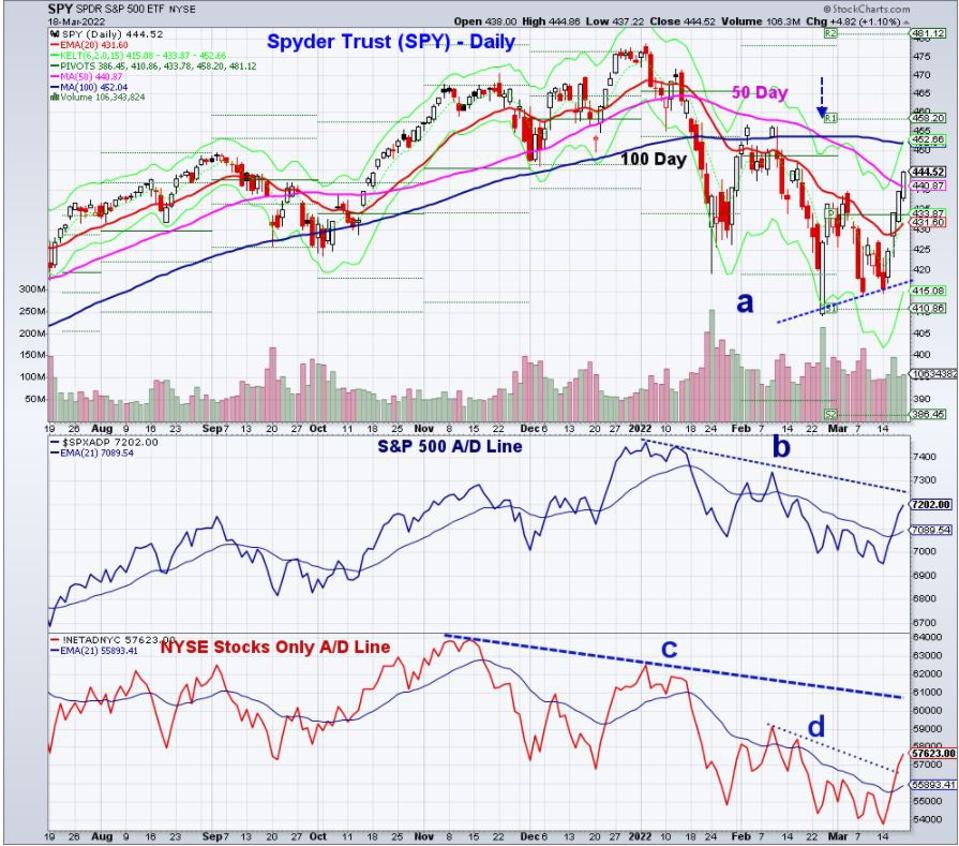
In watching the advance/decline numbers last week there was a surge of buying in the Nasdaq 100 ($NDX) on Tuesday, March 15th. The strong A/D numbers on Wednesday turned all the daily A/D lines positive as the S&P 500 A/D line which has been the strongest moved above its EMA. The A/D line still needs to surpass the downtrend, line b, to indicate more than an oversold bounce.
The NYSE Stocks Only A/D line has also moved above its EMA and the short-term downtrend, line d, with major resistance at line c. The fact the Spyder Trust (SPY) closed the week above its 50 day MA and the monthly pivot at $433.78 has gotten the market’s attention.
The fact that the declining 50 day MA is below the also declining 100 day at $452.04 suggests that it may take some time to complete a bottom. The 50% retracement resistance at $445.31 is just above Friday’s high with the 61.8% Fibonacci retracement resistance at $453.49.

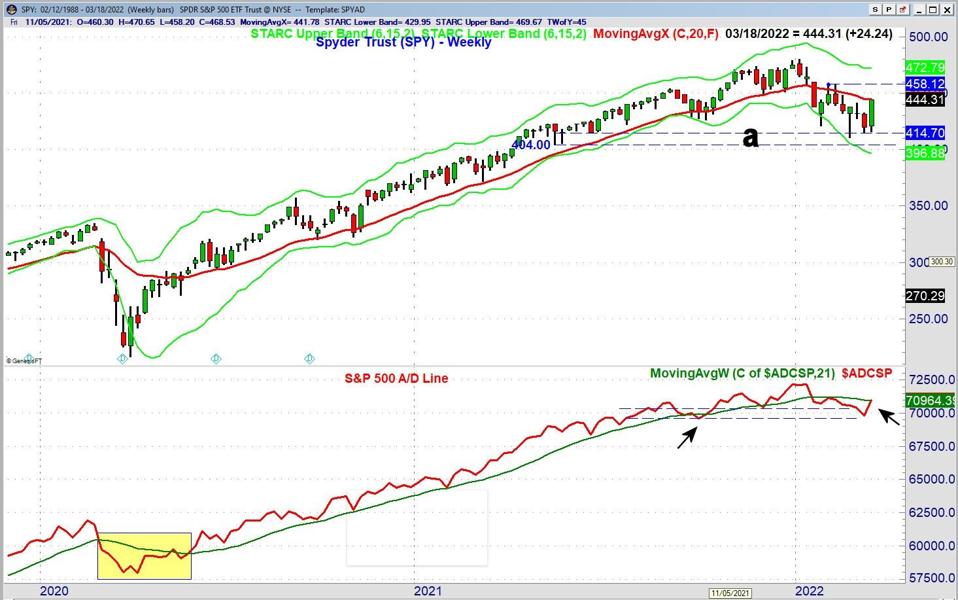
The weekly S&P 500 A/D line crossed back above its WMA last week turning positive for the first time since January 21, 2022. This is consistent with more than an oversold rally as long as it stays positive. The A/D line dropped below its WMA for two weeks in October 2021. Also during the market decline in 2020 (see shaded area) the weekly S&P 500 A/D line stayed negative for nine weeks. The weekly chart of SPY shows that the support from early 2021, lines a, appears to have held with weekly resistance in the $458 area.

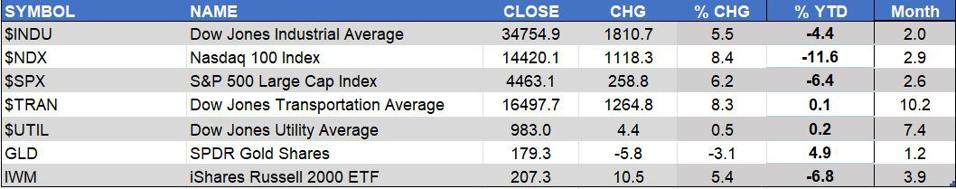
Though the S&P 500 ($SPX) had a solid weekly gain of 6.2% it lagged the 8.4% gain in the Nasdaq 100 ($NDX) and the 8.3% rise in the Dow Jones Transportation Average ($TRAN). $NDX and $SPX are still negative year-to-date (YTD) but not $TRAN which is up 10.2% in March.
The weakest market was the SPDR Gold Trust (GLD which was down 3.1% for the week but is still positive YTD. The defensive Dow Jones Utility Average was only up 0.5% last week but is still up 7.4% for the month.
The extent of last week’s gains allows for a pullback or consolidation this week and of course if the war in Ukraine escalates it could cause a dampening of last week’s optimism that was fueled by Fed Chair Powell’s comments. So which stocks are likely to perform the best over the near term?

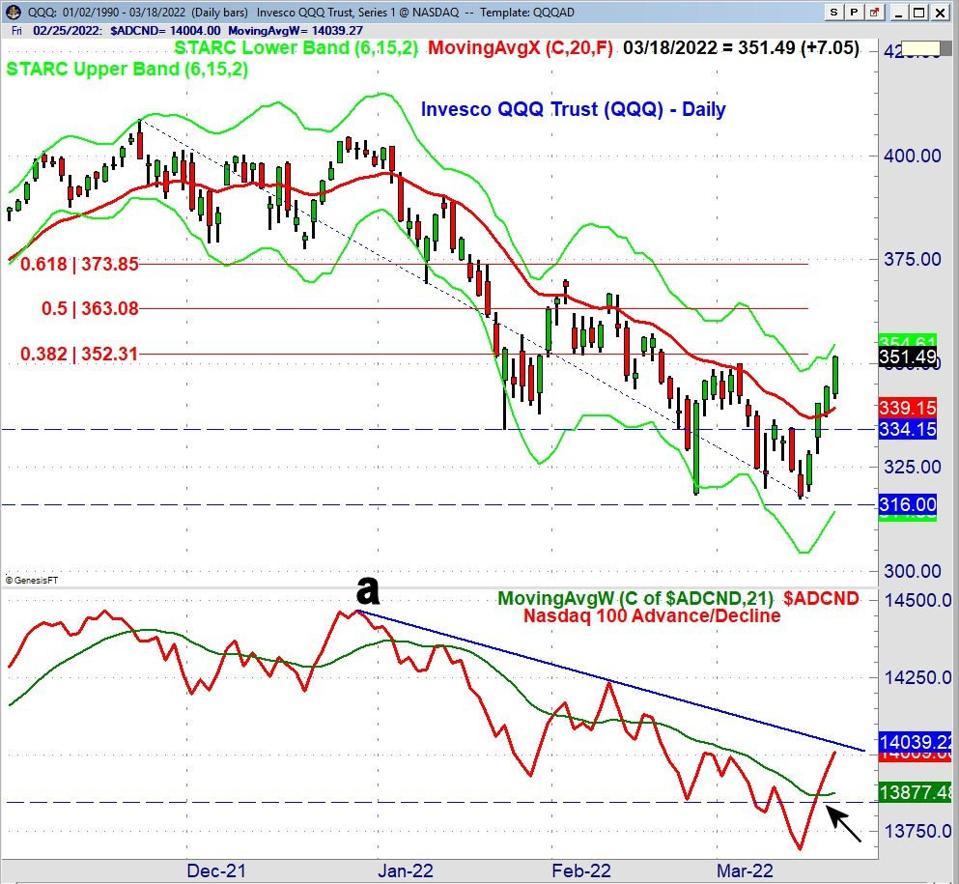
Even with the 8.35% gain last week in the Invesco QQQ Trust (QQQ) it is still down 14% from the November 22nd high of $408.71. The close was just below the 38.2% resistance at $352.31 with the 50% at $363.08. A close above the 61.8% level of $373.85 would convince many that the correction was over. Historically bear market rallies have been known to reach major retracement levels before they fail.
The Nasdaq 100 Advance/Decline line has moved sharply back above its WMA which is trying to turn higher. It is still below the downtrend, line a, and needs further improvement and time to suggest it has completed an intermediate-term low. If the A/D line pulls back early in the week I will be watching to see how it closes the week.

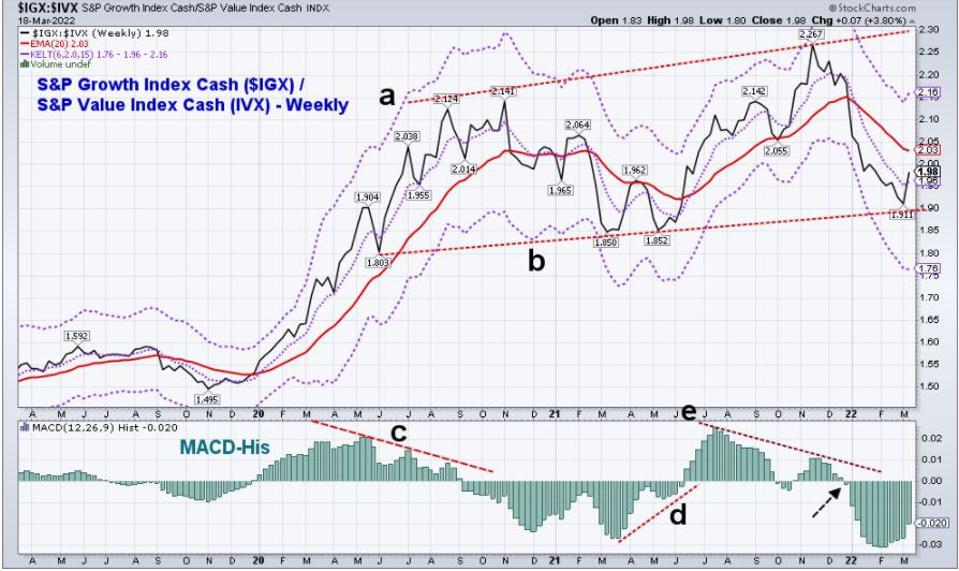
It was a good week for growth which was clearly more oversold than value. The ratio of the S&P Growth Index (IGX) to the S&P Value Index (IVX) turned higher last week after reaching the support, line b, that goes back to May 2020. The $IGX was up 8.2% last week while the $IVX gained 4.2%. The weekly and daily ratio analysis does suggest growth can outperform for a while longer but is more vulnerable to sharp downdrafts. The long-term charts do look more positive for the value ETFs.
A large part of the market pessimism is due to the conviction of many that we are heading into a recession or already in one. In looking at the data I am not convinced. For example, Friday’s Leading Economic Index rose 0.3% in February after a January decline and a December increase. It shows no signs of topping out but the Conference Board noted that the results “do not reflect the full impact of the Russian invasion of Ukraine”. Other data last week was a bit better than expected including the Empire State Manufacturing Index and the Philly Fed Index.
For now, the daily market outlook is positive, and if the A/D lines overcome major resistance then it will shift the focus on a resumption of the major trend. Until the moving averages of the A/D line start to trend higher one should still pay attention to the risk. For those who are convinced this is just a bear market rally remember they can often last longer than most expect.
Tom does do a limited number of one-on one training sessions. There is more information here or you can contact the office at wentworthresearch@gmail.com
Comments
comments