June 13, 2021: The stock market last week seemed on hold until Thursday’s widely watched report on the Consumer Price Index (CPI). Most of Wall Street was concerned that the market would drop sharply in reaction to the report. This conflicted with the technical outlook that I discussed last week which was more bullish. On Wednesday before the report, stocks reversed in the last hour as the Dow Jones Industrials closed 152 points down and yields on the 10 Year T-Note declined. Wall Street analysts were still concerned about the wild action in some of the “meme stocks”.
The CPI report came in slightly higher than expected at 0.6% which pushed the yearly rate of inflation to 5% from 4.1% the prior month. Used car prices were responsible for one-third of the increase. Though this was a 13-year high, the stock index futures traded higher after the report. The markets, unlike much of Wall Street, were apparently not worried as they seem to agree with the Fed that the inflationary effects were transitory.

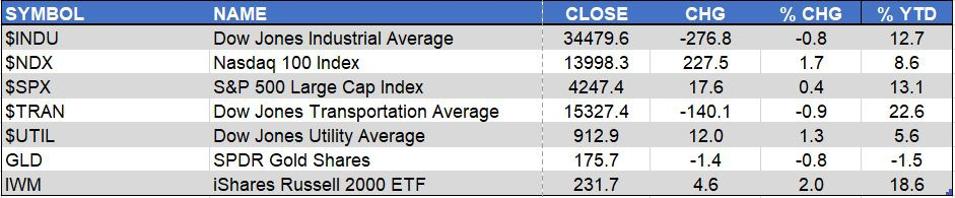
The iShares Russell 2000 (IWM)IWM was the best performer for the week as it was up 2% which was consistent with the upside breakout in the Russell 2000 Advance/Decline line that was pointed out last week (see chart). Though it is up 18.6% for the year, it has lagged the other market indices over the past three months as it is just barely higher.
The Nasdaq 100 Index finished the week strong as it was up 1.7%, over three times the gain in the S&P 500 which was up just 0.4%. Both the Dow Jones Industrial Average and Dow Jones Transportation Average were down less than 1% as was the SPDR Gold Trust.

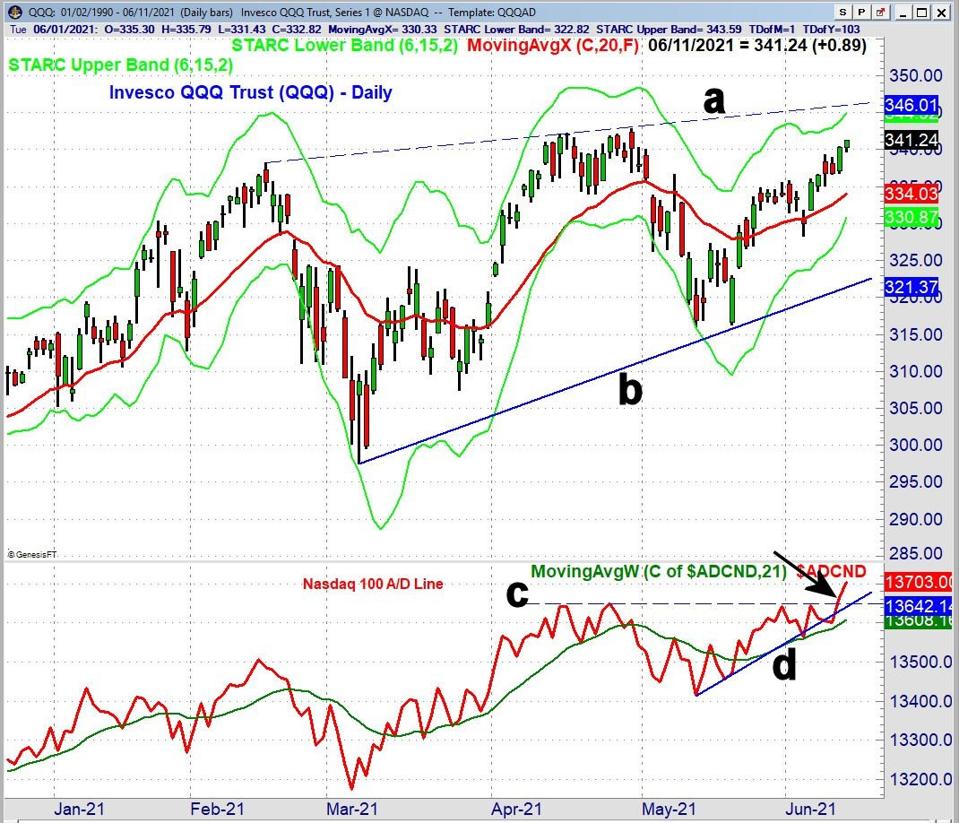
The Invesco QQQ Trust (QQQ)QQQ gained strength late last week but has still not made a new all time high like the S&P 500 did last week. The chart has trendline resistance, line a, in the $346 area. A decisive close above this level would give much higher targets with the weekly starc+ band at $358.76. There is initial support for QQQ at $334.03 and the 20-day EMA with much stronger at $321.37, line b.
The Nasdaq 100 Advance/Decline line has been trying to hold the uptrend, line d, since the mid-May lows as it has been tested several times. The A/D lines surged through the resistance at line c, last week and is now projecting significant new highs.

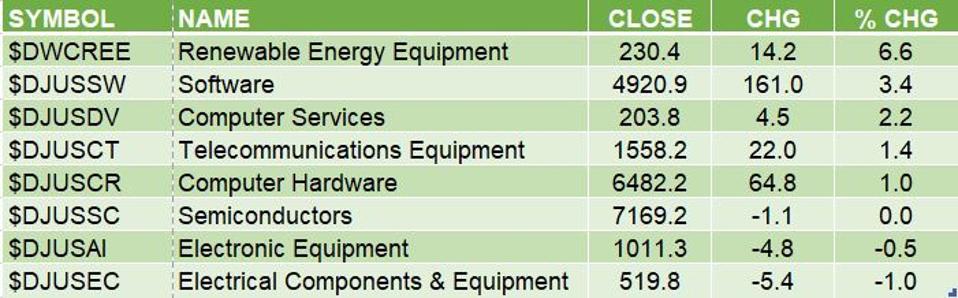
In a review of the industry groups that make up the technology index there were two distinct leaders last week. The Renewable Energy Equipment ($DWREE) gained 6.6% last week followed by a 3.4% gain in Software ($DJUSSW).

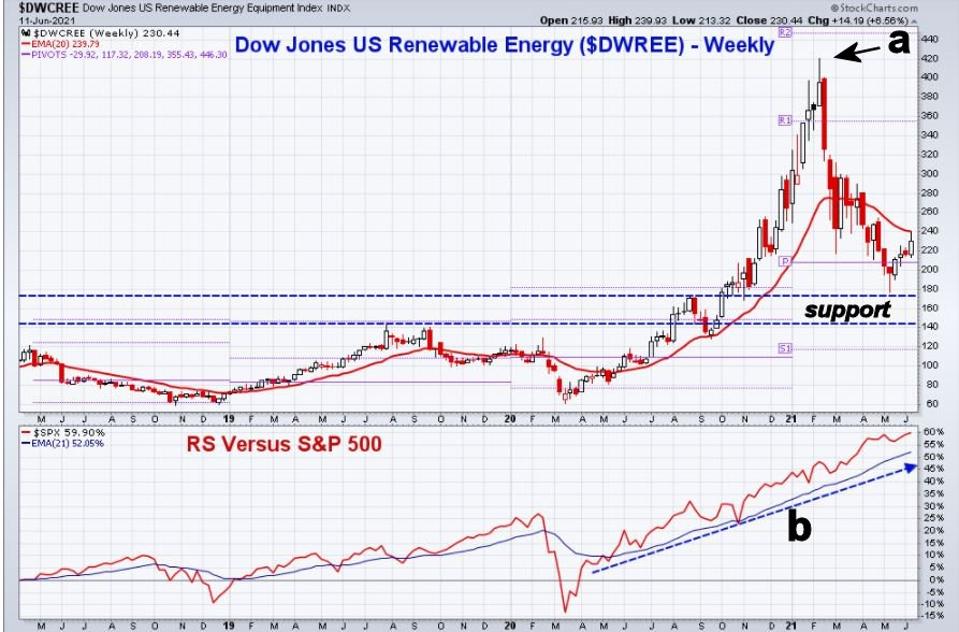
The Renewable Energy Equipment industry group had a high of 420.4 in early February, point a, and reached a low of 177.2 in May. This was a drop of 58% as $DWREE had rallied well above the yearly R1 resistance 355.4 in the first two months of the year before declining back below the yearly pivot at 208.2. This caused a major shift in the sentiment that was extremely bullish after the election of President Biden.
The declining 20 week EMA at 239.79 was tested last week with further support in the 208 area. There is a strong band of long-term support in the 145 to 177 area. The relative performance (RS) reversed sharply above the zero level three weeks after the March 2020 low, closing above its EMA in the middle of May. The RS measures the performance of the industry group versus the S&P 500 and has been in a strong uptrend, line b, for over a year.
Three of the best-performing stocks in this industry group over the past 12 months are; Plug PowerPLUG (PLUG), FuelCell EnergyFCEL (FCEL) and Enphase EnergyENPH (ENPH).

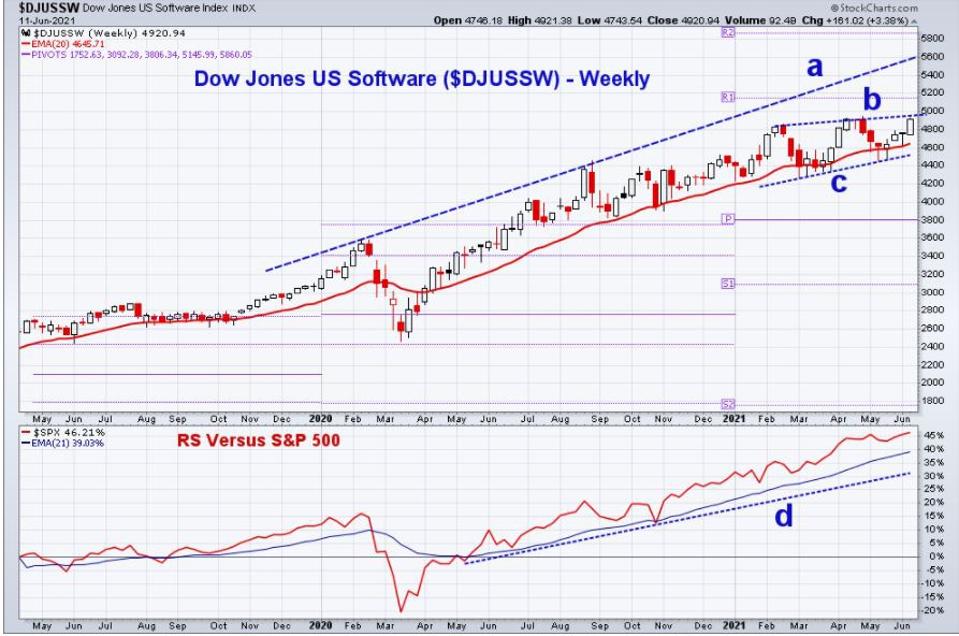
The weekly chart of the Dow Jones US Software ($DJUSSW) shows a powerful uptrend from the March 2020 lows which has doubled. This industry has formed a flag formation, lines b, and c. An upside break from this formation would project a move to the long-term resistance in the 5600 area, line a. This is 13.8% above Friday’s close.
The rising 20 week EMA is at 4745 with more important weekly support at 4450 which was the May low. A drop below this level could signal a change in the positive major trend. The relative performance (RS) turned positive in May 2020 and has been in a strong uptrend, line d, over the past year. The RS is also well above its rising WMA. Three of the best-performing stocks in this industry group over the past 12 months are; Fortinet Inc.FTNT (FTNT), Shift4Payments (FOUR) and EPAMEPAM Systems (EPAM).

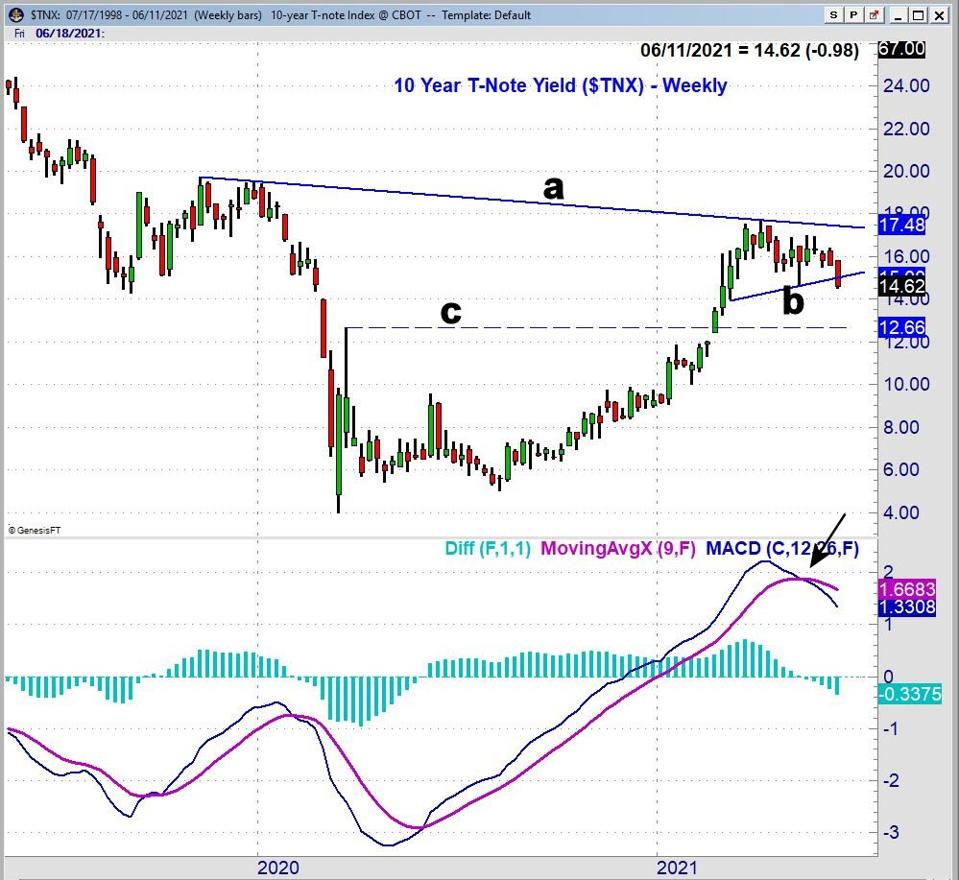
The sharp decline in the yield on the 10 Year T-Note last week caught many by surprise. The technical studies, like the weekly Moving Average Convergence-Divergence (MACD), had been negative for the past month which favored the drop below support at line b. There is support now in the 1.400% area with further at 1.266% area, line c.
The upward grind in the major averages for the past few months has made it necessary to wait for those brief market corrections to reduce the risk on new long positions. However, there have been rotations within the sectors and their industry groups that have created new opportunities. Each week there are stocks that look attractive from a technical standpoint and two that were on my monthly buy list from May have acted well.
In the Viper ETF Report and Viper Hot Stocks Report, I update subscribers with my market analysis at least twice each week and provide specific buy and sell advice. I follow both growth and value ETFs. Each report is just $34.95 per month. New subscribers also receive six free trading lessons, a $49 value.
To learn more about the stock market and investing take advantage of this limited time special offer to spend 90 minutes with Tom.
Comments
comments