

The strong selling in the futures last Sunday evening and early Monday took the March E-mini S&P 500 futures to a low of 3656. The futures were over 80 points higher by Monday’s NYSE open, and the buying lasted all week. The buyers seemed unconcerned by the prior week's tumult around Gamestop, as they found a number of positive developments to focus on.
While the monthly jobs report was not encouraging, many of the other economic reports last week were better than expected. Additionally, the earnings from big tech stocks like Alphabet Inc. (GOOGL) and Amazon.com (AMZN) gave the market a boost, as they were up 14.3% and 4.6% respectively. With more than half of the S&P 500 stocks reporting, 95% have beat the profit estimates and 88% beat their revenue estimates.

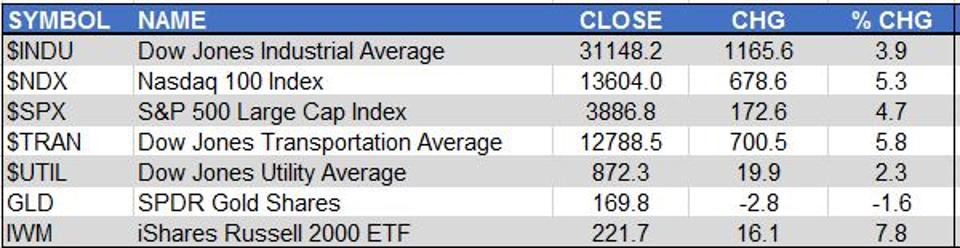
The 5.3% weekly gain in the tech-heavy Nasdaq 100 was therefore not surprising. The Dow Jones Transportation Average, which had been declining since early January, saw a much-needed rebound of 5.8%. But the leader again last week was the iShares Russell 2000, which was up 7.8%.
All the major markets were higher for the week. The SPDR Gold Shares (GLD) were down, hurt by higher yields. The iShares Silver Trust (SLV), which was a new target for the Robinhood short squeezers, was pretty much unchanged for the week.

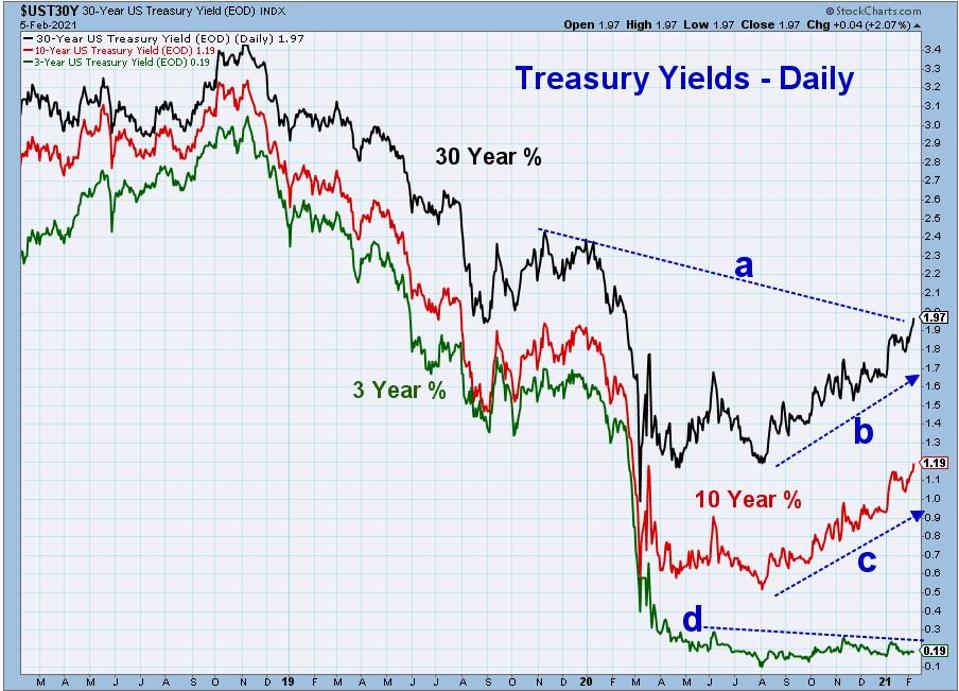
The rally in many interest rates has been quite dramatic in 2021. The yield on the 30 Year T-Bond was 1.650% at the end of 2020, but closed last week at 1.97%. This overcame the downtrend going back to the late 2019 high (line a).
There was been a similarly-dramatic increase in the 10 Year T-Note yield. It has increased sharply from 0.930% to 1.19% (line c). The downtrend from the 2018 and late 2019 peaks (not shown) was overcome in early December, with next resistance in the 1.40-1.50% area.
Investors do not seem concerned about the rise in rates. Short-term rates, as represented by the yield on the 3 Year T-Note, have stayed flat for the past eight months. There is important yield resistance in the 0.28% area (line d).

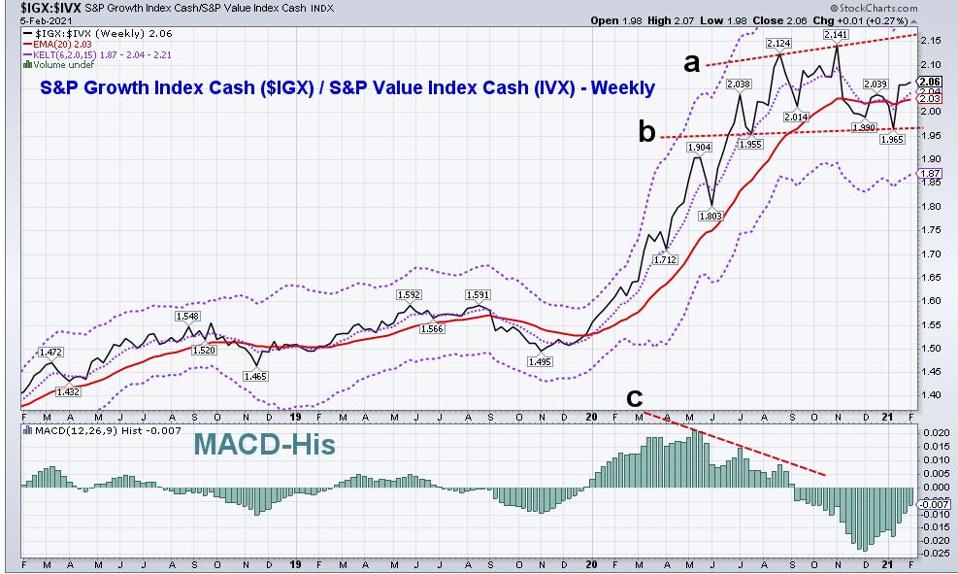
The higher yields have helped the value stocks keep up with growth stocks. The S&P Growth Index Cash ($IGX) was up 4.8% last week, while the S&P Value Index Cash ($IVX) was up 4.5%. The ratio between $IGX and $IVX, charted above using weekly data, rises when growth stocks are stronger than value stocks.
The market has been favoring growth since 2007. Since last summer, the ratio has been in a broad trading range, peaking in November at 2.141. Resistance is now in the 2.16 area (line a). There is good support in the 1.955-1.965 area (line b). The weekly Moving Average Convergence-Divergence (MACD) Histogram has diverged from prices since July and August, (line c) and was negative when the ratio made its high in early November.
Even though the MACD-His is still below the zero line and negative, the ratio could still breakout in either direction. The trading range (lines a and b) could be just be a continuation pattern, a pause in the uptrend which could set the stage for another rally phase. Conversely, a decisive close below 1.955 is likely to signal an important top, like what was formed in 2000, leading value stocks to outperform growth until 2007.

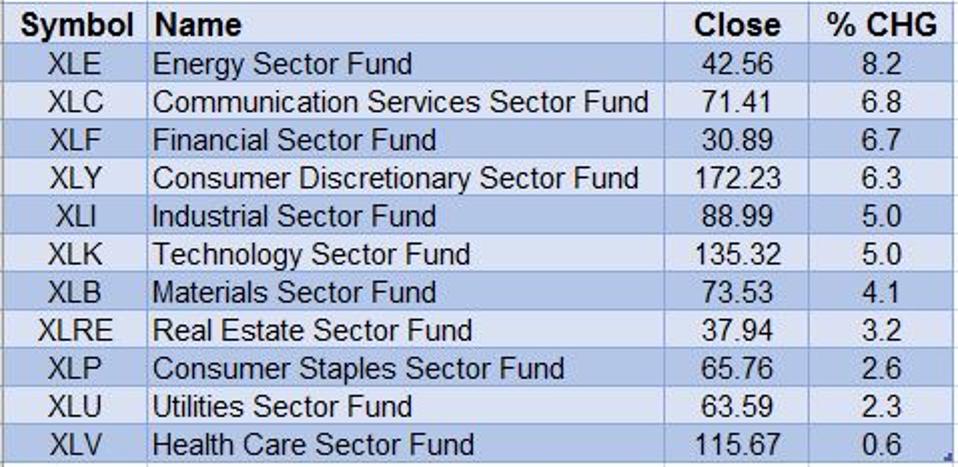
The weekly sector performance was also very positive, led by the 8.2% gain by the Energy Sector (XLE). According to Morningstar, that is better than the yearly total return for XLE in five of the last seven years. Three other ETFs, the Communication Services (XLC), Financial Sector (XLF) and Consumer Discretionary (XLY), were all up over 6% of the week.
At the bottom of the list were consumer staples, utilities, and healthcare. These sectors are considered to be more defensive, as they tend to perform better during market corrections. My weekly technical studies are improving, but not yet positive, for the Utilities Sector (XLU) or Consumer Staples Sector (XLP).

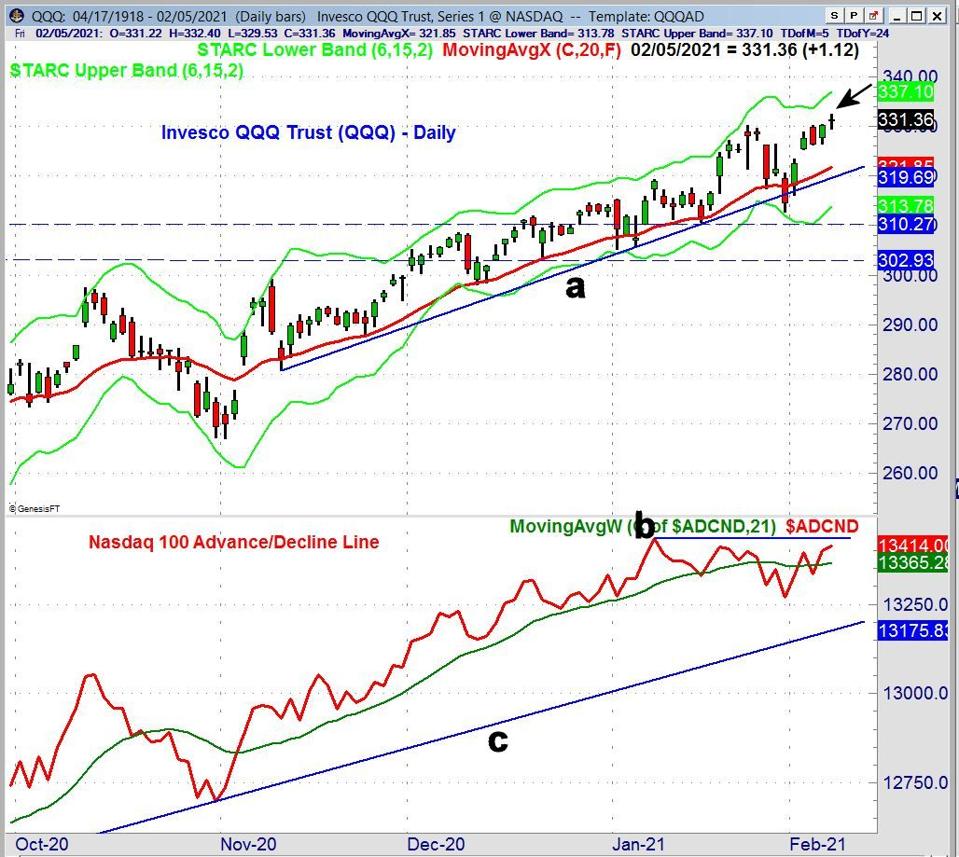
Last week I reminded readers that the Nasdaq 100 Advance/Decline (A/D) line had failed to make a new high since January 8, and has continued to diverge from prices. This is a sign that as the QQQ has moved higher, fewer stocks are joining the rally. On January 25, the Invesco QQQ Trust (QQQ) had made a new high at $330.32.
That high was exceeded last week, as the QQQ reached $332.40 on Friday before falling to close near its open for day, forming a doji. The A/D line has not made any new highs (line b), diverging from prices. These negative (bearish) divergences often, but not always, warn of a market correction. This is the only A/D line that has diverged from prices. The QQQ has a band of stronger support in the $310.27 to $302.93 area, with major A/D line support at the uptrend from the September 2020 low (line c).
It has been three months since early November's strong buy signals, and the market’s risk profile is higher now than it was then. The key markets are now within 5% of their starc+ bands, which is one sign of increased risk. Bullish sentiment is also much higher than it was three months ago, which is another cause for concern.
Though the monthly, weekly, and daily outlook for the market is positive. I would continue to only recommend buying ETFs or stocks when they are close to support. It is still my view that a deeper decline is needed to reduce the high level of complacency in the market. Such a decline should present a good buying opportunity for selected ETFs and stocks.
In my Viper ETF Report and Viper Hot Stocks Report, I update subscribers with market analysis twice per week, along with specific buy and sell advice. Each report is just $34.95 per month. New subscribers also receive six free trading lessons, a $49 value.
If you are interested in a one on one training experience with Tom Aspray this special offer is available for a limited time.
Comments
comments