

The markets took a long awaited pause last week as the Dow Industrials declined 0.5% as did the Nasdaq Composite while the S&P 500 lost 0.7%. The decline corresponded with a drop in crude oil prices after the May contract moved briefly above the $42 level.
The drop in crude was attributed to an increase in supply. This was the sixth week in a row where supplies had increased however the 9.4 million barrel jump was more than three times the average forecast.
My analysis of crude oil in 2016 provides a good example of a missed opportunity. On January 21st I wrote a column " Time To Squeeze The Short Oil Speculators?" where I expressed my view that crude oil was ready for a short covering rally.
Psychology plays an important role in one's investing success so by concentrating on ones mistakes you are less likely to succeed in the future. Many investors and traders spend too much time over their missed opportunities. This is the reason I have always placed a strong emphasis on having a plan and focusing on the risk rather than the potential reward of any investment.
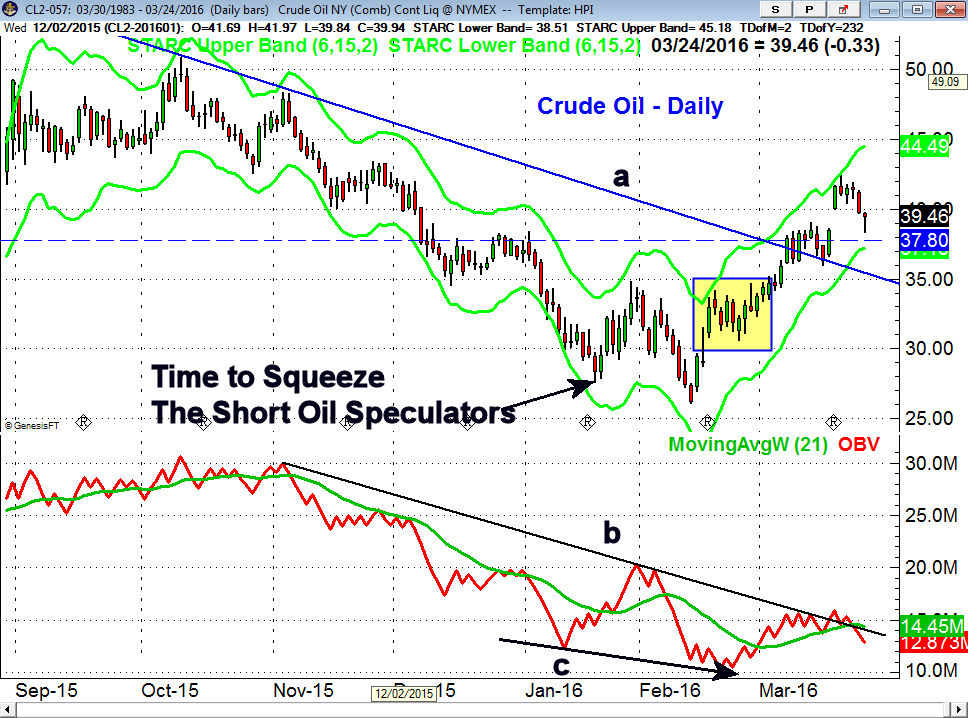
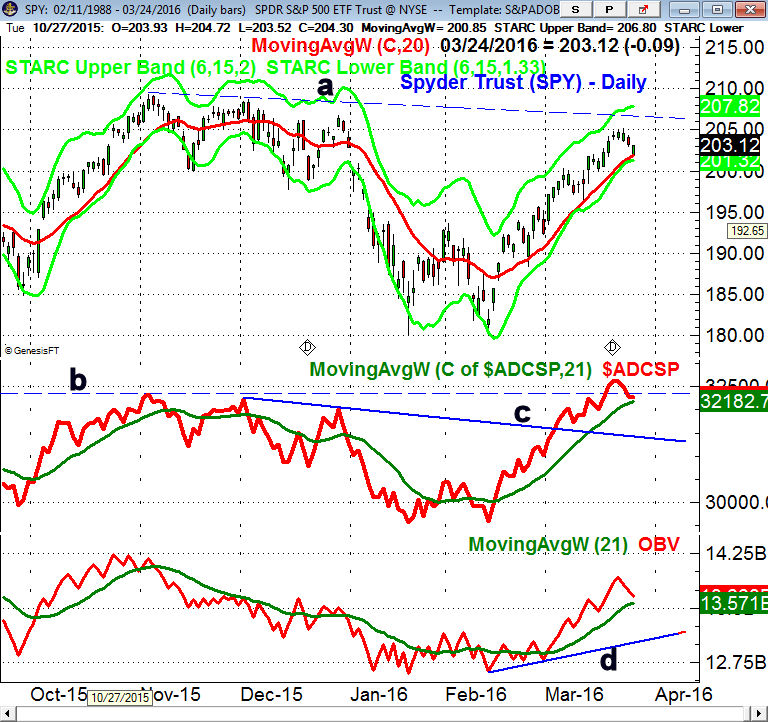
Crude oil rallied from a low of $27.56 to a high of $34.82 before it again turned lower making a new low on February 11th. Though my technical indicators did suggest the stock market was bottoming at the time (Is There Blood In The Streets Yet?) there were no similar bullish signs for crude oil. The OBV, one of the most reliable technical studies, made sharply lower lows with prices (line c) which was not a bullish sign.
Still crude oil rallied sharply back to the late January highs before it again turned lower (see highlighted section). In over 30 years of studying and trading crude oil I knew that the odds favored a pullback to the $29-30 area where stronger buy signals would emerge.
Instead the correction was quite shallow and while the OBV did move above its WMA the volume was not impressive. The OBV has still not been able to convincingly overcome the long term downtrend, line c. By the time crude reached the $33.50-$34 area a stop of over 10% would have been required on longs which given the upside in the $38-$40 area made the risk/reward unfavorable. There were also not clear bullish signals in the energy ETFs as there were in the material sector.
Although I was frustrated by this it did not change my methods or my way of analyzing the markets. In my experience too many investors or traders adopt a method or strategy until they miss a trade or lose money and become frustrated. It is at that point that they then decide to find a new approach.
Having a steadfast plan or strategy is often the most difficult challenge for investors or traders. While prices were plunging in January I advised investors not to bail out as I was confident there would be a strong rally by the end of the quarter where portfolios could be evaluated.
Selling out on the decline was not surprising as the sentiment was close to suicidal for even the most seasoned investor. Those that had a plan to stay invested until there were clear signs of a bear market now feel pretty good while those who sold out are now questioning their methods. This has caused a crisis of confidence for many
It is my hope that those who sold will not become disillusioned by the stock market since there are no warnings of a bear market. Most importantly stay patient as there is never a good reason to sell in a panic or to chase prices higher as you will always have another chance. There should be a correction in the coming weeks if you want to buy.
Valeant Pharmaceuticals (VRX) stayed in the news last week even though it rebounded sharply and gained 16.3% for the week. The stock was the focus of last week's column (The Week Ahead: Investor Meltdown - What Were These Pros Thinking?) as I tried to urge investors, as I have in the past, to know what you are buying.
This case illustrated how having an oversized position in any one market can be disastrous to your portfolio. Employees of companies like Enron learned the same painful lesson. Though I thought it was inexcusable for Sequoia Fund to have such a large percentage in VRX it was unfortunate that this one investment ended the long and successful career of fund manager Robert Goldfarb.
As was the case in 2015 this year has been one where investors have had to be selective. Last year the SPY was up just 1.25% while the Consumer Discretionary Sector Select (XLY) as up 9.9%. The weekly relative performance on the XLY moved above its WMA at the start of the year and did not drop below it until December 2015.
A Wall Street Journal article pointed out last week how poorly the Nasdaq Composite had done so far in 2016 when compared to some of the other major averages. Through the close last week the Nasdaq Composite is down 4.7% YTD while the SPDR Dow Industrials (DIA) is up 1.2%.
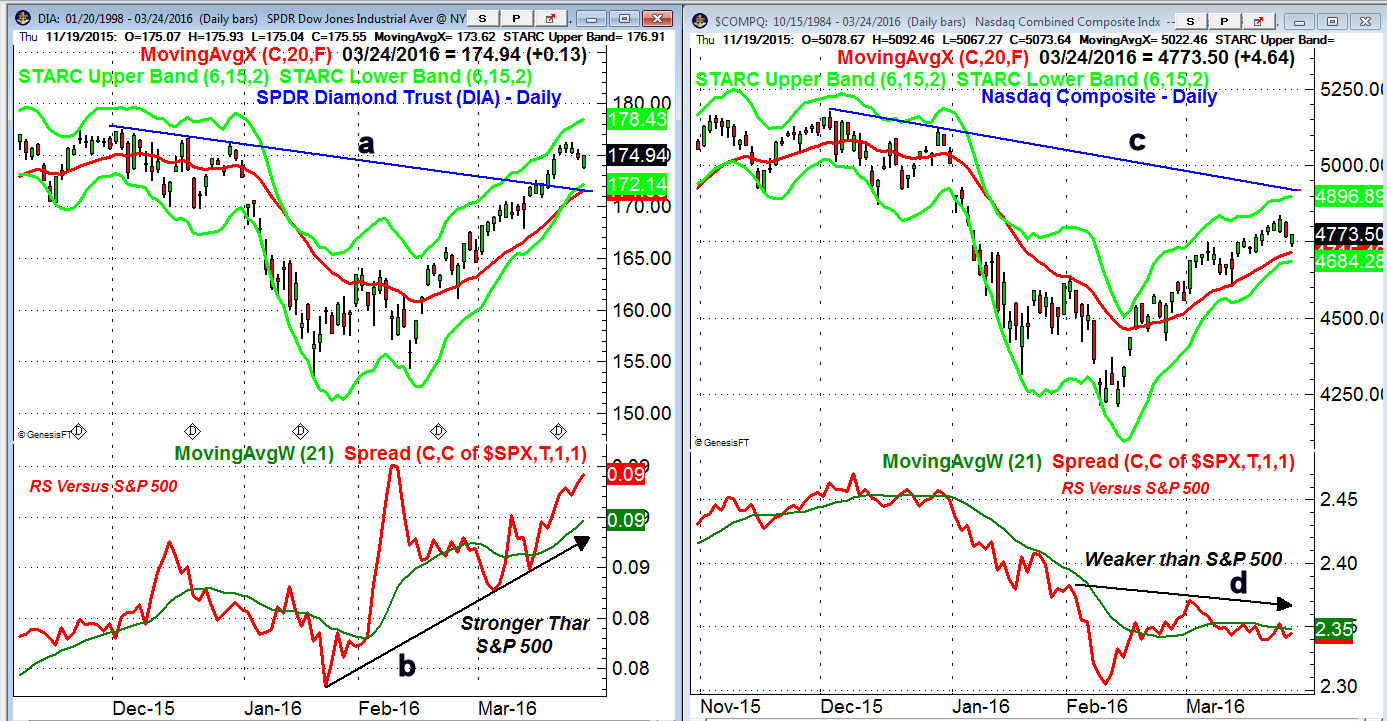
The daily chart of DIA shows that it overcame the downtrend, line a, from the December highs seven days ago while the Nasdaq Composite is still well below its similar downtrend, line c. The difference in performance was signaled by the RS analysis which made DIA the favorite for Viper ETF clients.
During the rebound in late January and early February the RS turned higher on DIA and moved back above its WMA. It then surged at the February 11th lows as the Dow Industrials A/D line was forming a bullish divergence. The RS line is still in a strong uptrend as has DIA has continued to act stronger than the S&P 500.
This is in contrast to the action of the relative performance on the Nasdaq Composite which made a sharply lower low with prices in February. Though it did surpass its WMA at the end of the month it has made lower highs in March (line d) consistent with a market that was lagging the S&P 500.
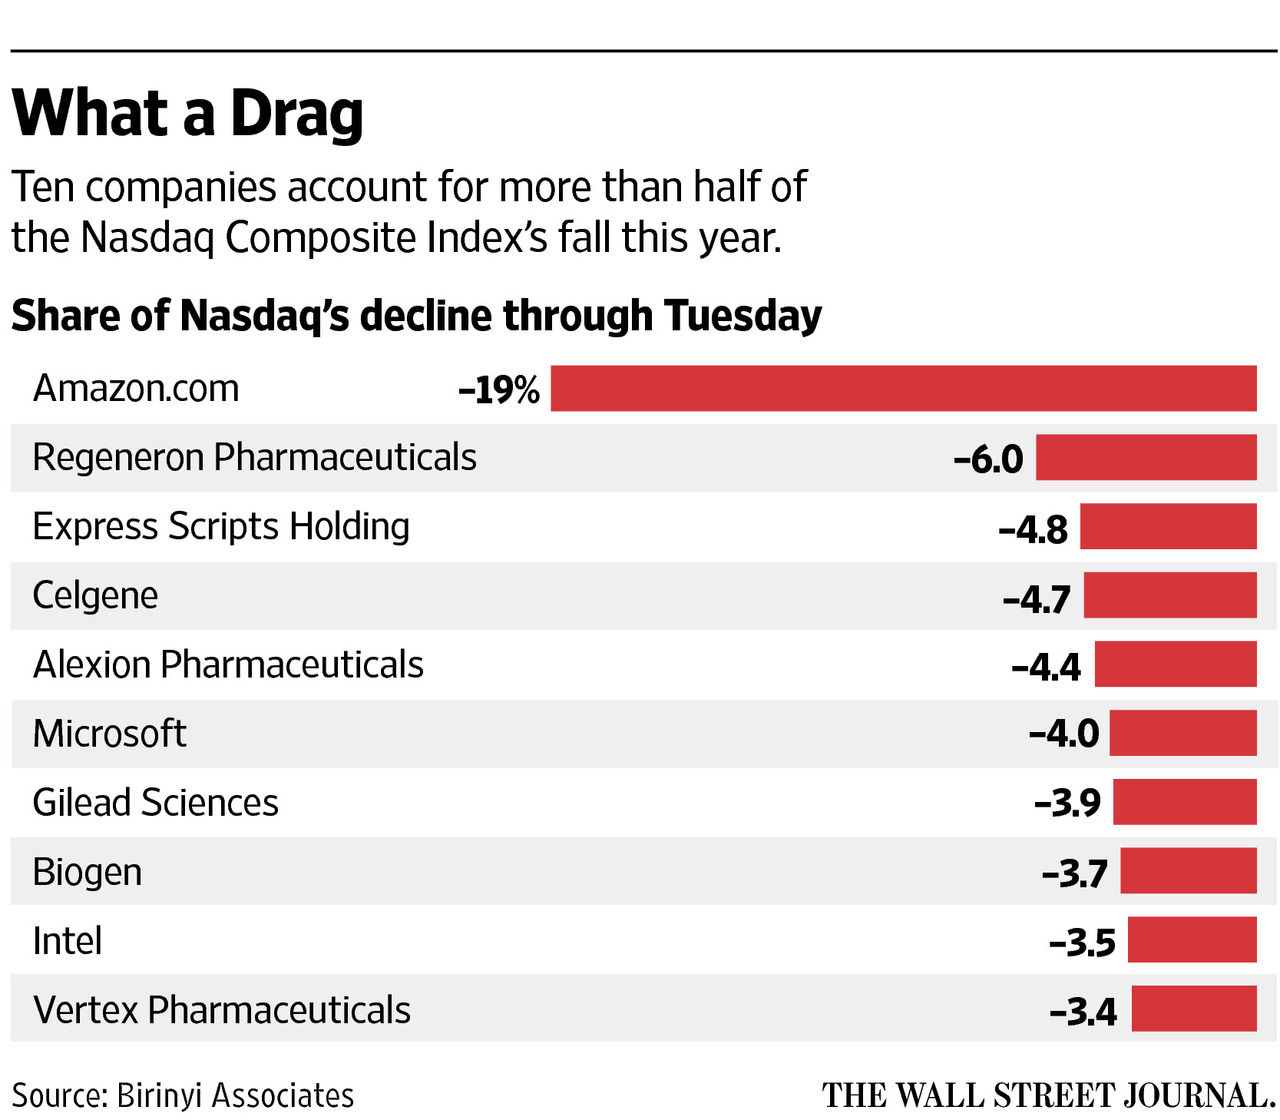
This table from the WSJ shows that just ten of the Nasdaq Composites stocks have accounted for more than half of the Nasdaq Composites decline through last Tuesday. If you had an overly large position in Amazon.com (AMZN) your performance would be much worse than if you had a diversified portfolio as AMZN is down 13.8% so far in 2016.
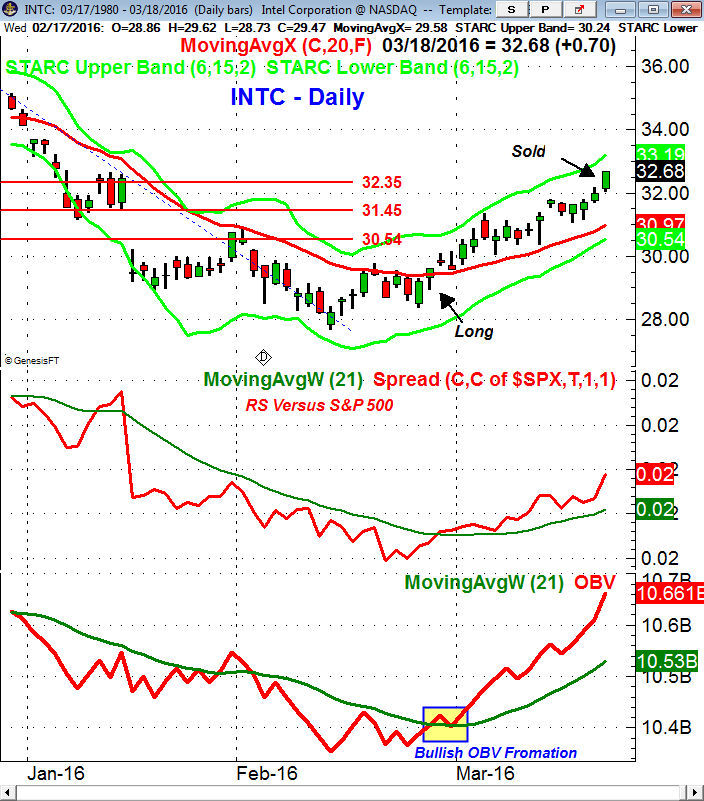
Some of these stocks other than AMZN have presented some good trading opportunities as Intel Corp (INTC) had a good buy setup on February 25th as the momentum had turned positive by moving above its WMA. The OBV had dropped back to its WMA creating a bullish zig-zag formation. This trading position was just held in the Viper Hot Stocks portfolio for sixteen days reaffirming my view that 2016 is not yet a buy and hold market like we have seen in banner years like 2013.
As I have been saying for the past week or so this is not currently a market where you should be an aggressive buyer. The outlook for the US market is detailed in the Market Wrap section but one factor that has me concerned is the relatively weak rebound in the Euro markets.
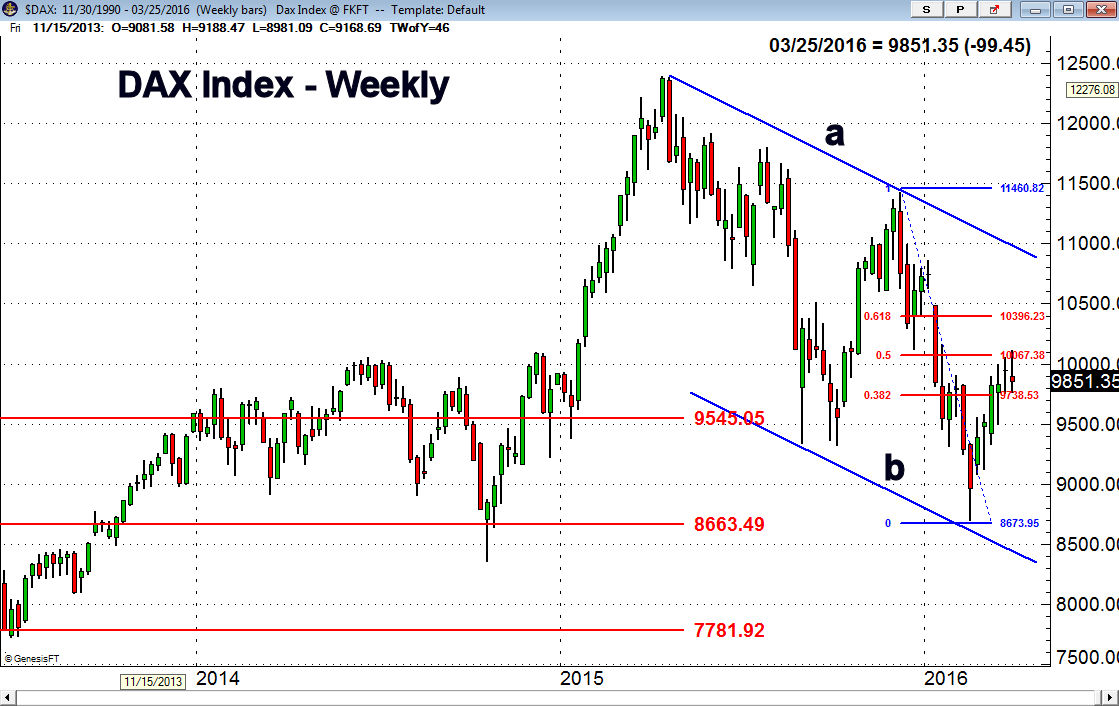
In my analysis in early March I commented that the German Dax Index had dropped back to the major 50% support level and then turned higher. Some of the momentum indicators like the MACD-His did form positive divergences at these lows.
Not only has the rally so far failed to reached the downtrend, line a, in the 10,900 area it has just reached the short term 50% resistance from the December highs. The DAX formed a doji two weeks ago and closed lower last week which is not surprising given the recent horrific events in Europe. The rebound so far has the characteristics of a rally within a downtrend and a drop much below the 9300 level would suggest the rally was over.
The Economy
Most of the economic data last week was not enough to stimulate new buying in the stock market as the comments by some Fed Governors about the possibility of another rate hike in April made some traders nervous.
The Chicago Fed National Activity Index Monday came in at -0.29 and was weaker than expected. Utility output was weak while the manufacturing output was up 0.2%. Existing Home Sales also dropped sharply and were weaker than expected due in part to a lack of available supply.
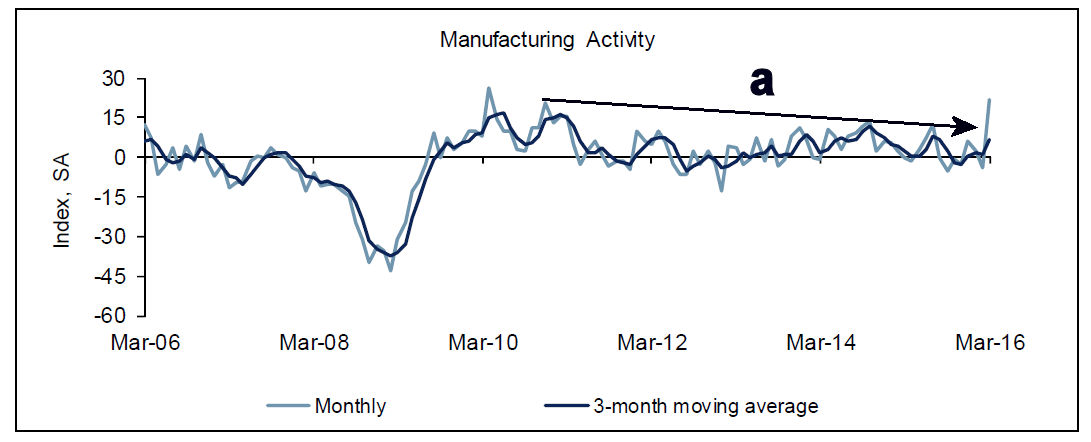
There were no signs of a significant pickup in factory activity from the flash reading on PMI Manufacturing. The Richmond Fed Manufacturing Index improved sharply to 22 which was the strongest reading since April 2010 as new orders surged. The chart shows the breakout above six year highs, line a, but to confirm we need to see more positive data in the coming months.
New Home Sales were up 2% in February but Thursday's Durable Goods was a disappointment as they were down 2.8%. Econoday commented that the weak orders "will pull down first-quarter GDP estimates".
Unlike some of the other more encouraging data the Kansas City Manufacturing Index was weak at -6 but better than February's reading. The final reading for 4th quarter GDP was better than expected at 1.4% while most were looking for 1.0%. Stronger consumer spending help boost the GDP which is a positive sign going forward for the economy. Friday's drop in corporate profits is a concern as they were down 3.6% because of the weakness in energy and chemical companies.
The schedule is full this week with Pending Home Sales and the Dallas Fed Manufacturing Survey on Monday followed on Tuesday by the S&P Case-Shiller HPI and Consumer Confidence.
The ADP Employment Report is out on Wednesday with the Chicago PMI on Thursday In addition to the monthly jobs report on Friday we also have the PMI Manufacturing Index, ISM Manufacturing Index, Consumer Sentiment and Construction Spending.
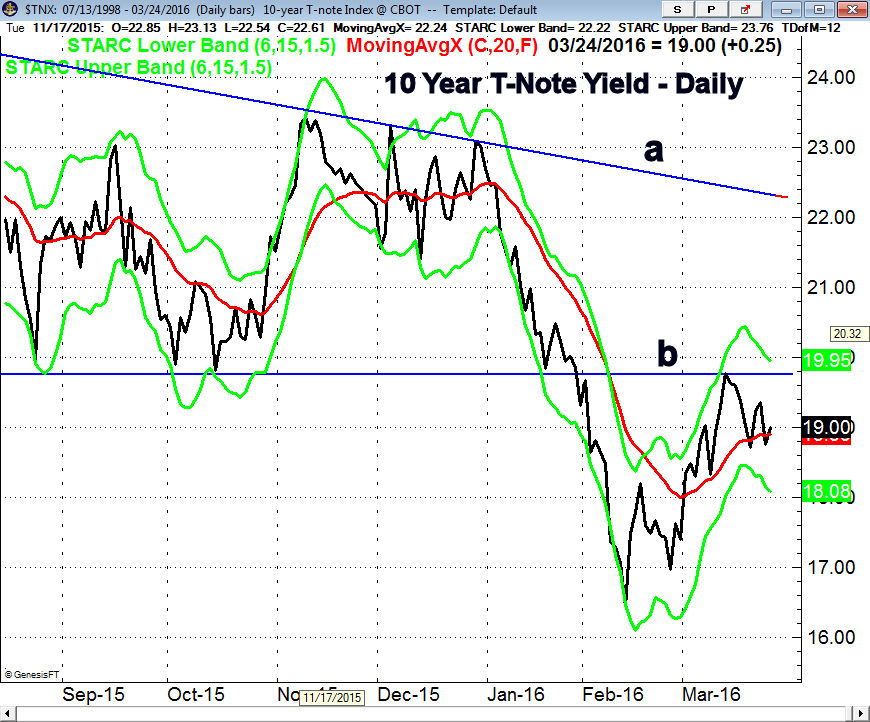
The yield on the 10 Year T-Note rose last week as the rally from the February low in yields has continued. A move above the 2.00% level (line b) is needed to signal higher yields while the long term downtrend is at 2.22%.
The stronger dollar last week pressured the commodity markets last week and stronger sell signals were generated in the gold market ( " How To Use Inverse ETFs For Timing and Trend Confirmation"). The longer term analysis does indicate that the correction will present a buying opportunity. The crude oil market does look closer to completing a top but there are no strong sell signals yet.
Market Wrap
At the February lows I stressed that it was the strength or weakness of the market internals on the rally that would tell us whether it was a bear market rally or a resumption of the bull market.
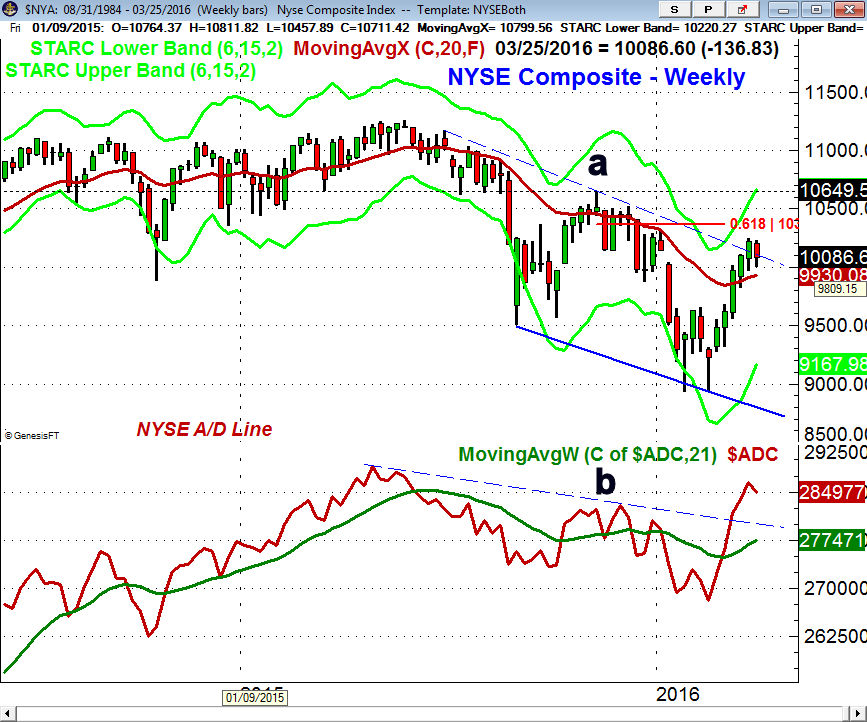
At the start of March the NYSE A/D line moved through its downtrend, line b, which was a sign of strength. This was the first indication that this was more than a bear market rally.
The ability of the A/D line to also overcome the late 2015 highs was also a bullish sign. The weekly chart of the NYSE Composite shows that it traded last week inside the prior week's range. This makes it a bit less likely that we will see a rally to the 61.8% resistance at 10,362 before the market consolidates or corrects.
The initial support is at 9930 and the 20 week EMA with stronger at 9550-9700. It would not be surprising to see the A/D line pullback to its rising WMA when the market corrects.
The Spyder Trust (SPY) failed to reach the downtrend (line a) at $206.60 as it stalled in the $205 level before pulling back to the 20 day EMA at $201.86 on Thursday. There is additional support now at $200 with the last swing low at $196.36 which is very close to the 20 week EMA at $196.50.
The daily S&P 500 A/D line formed a bullish divergence at the February lows and has now moved well above the November highs, line b. It is still below the May 2015 highs which must be overcome to give an all clear signal for the bull market.
It will likely take some time before there are clear signs that the A/D line has topped out. The OBV is still holding above its WMA and the uptrend, line d. It is still lagging prices as it is well below the highs from last fall.
The weakness in biotech has held back the Nasdaq 100 which shows a more sluggish uptrend. The PowerShares QQQ Trust (QQQ) was able to overcome the 61.8% resistance at $107.62 last week. The Nasdaq 100 A/D line did make a new high with prices with good support for QQQ now in the $103-$105 area.
The small cap iShares Russell 2000 appears to be forming a continuation pattern that favors another push to the upside before a deeper correction. The formation has targets in the $114-$116 area where major resistance exists.
What to do?
The March the continued improvement in the technical evidence have made it more convincing that the February low was a intermediate term bottom in the ongoing bull market. However it will be the nature of a correction in the next few weeks that will tell us more. It would take several weeks of sharply lower prices and very negative A/D numbers to alter the outlook.
I would not be surprised to see another push to new rally highs before we see a deeper and more sustained correction. The monthly jobs report and full slate of economic reports are likely to cause an increase in volatility this week. I would still not be chasing the overall market higher and would be looking to take some profits on strength.
For those not invested a correction will set up a better risk/reward opportunity to invest in diversified ETFs or in some of the currently bullish but overextended sector ETFs. If you sold out during the January slide be patient and take time to review your investment plan.
For traders there are still some good opportunities in individual stocks. If you are interested in trading the high momentum stocks in the IBD Top 50 and Nasdaq 100 you might consider the Viper Hot Stocks Report.
Comments
comments