

The S&P 50O finally was able to close above 2100 on Thursday only to have investors shocked by a much weaker than expected jobs report. It came in at 38,000 well below most analysts expectations as one so called 'expert" was looking for 195,000. Since the start of the bull market this pundit has been looking for higher inflation, the destruction of the dollar and an economic collapse.
I have long argued that getting your investment plan from any expert's comments, especially those on TV, is a prescription for financial disaster. Though many will not admit it becoming a successful investor requires hard work and dedication. Unfortunately many are under the assumption that if they can just pay someone a huge chunk of money for the "real secret" little further work will be required.
Trump University wasn't the first and won't be the last investment program to temp gullible investors by an easy path to investing success. In the past few years one trader told me at a conference that he had just paid $40,000 to enroll in a trading program and was confident that he would succeed. I am not optimistic that things panned out as he expected.
Thanks to the internet you are now able to research the past history of any advisor or expert you are thinking about following. If they are very bullish or very bearish you want to find out whether they have had this view for a few months or a few years. In the odd chance you can't find anything then you should start taking notes of their advice and then study them before you make a decision.
It has long been my belief that anyone who is willing to devote the time and energy can become their own expert or advisor. Of course I favor a technical rather than a fundamental approach but there are a number of fundamental analysts that have done well over the long term. In the past I have written a number of trading lessons that explain the methods that I use to determine the market's direction as well as pick ETFs or stocks to buy or sell.
Currently many analysts remain skeptical of the current market rally. Some have been bearish since early in the year while others have been warning about the coming market crash for many years. Even though the S&P 500 did close above 2100 last week the repeated rally failures at this level has been a common theme amongst the bears. This high negative sentiment is reflected in the currently high put/call ratios.
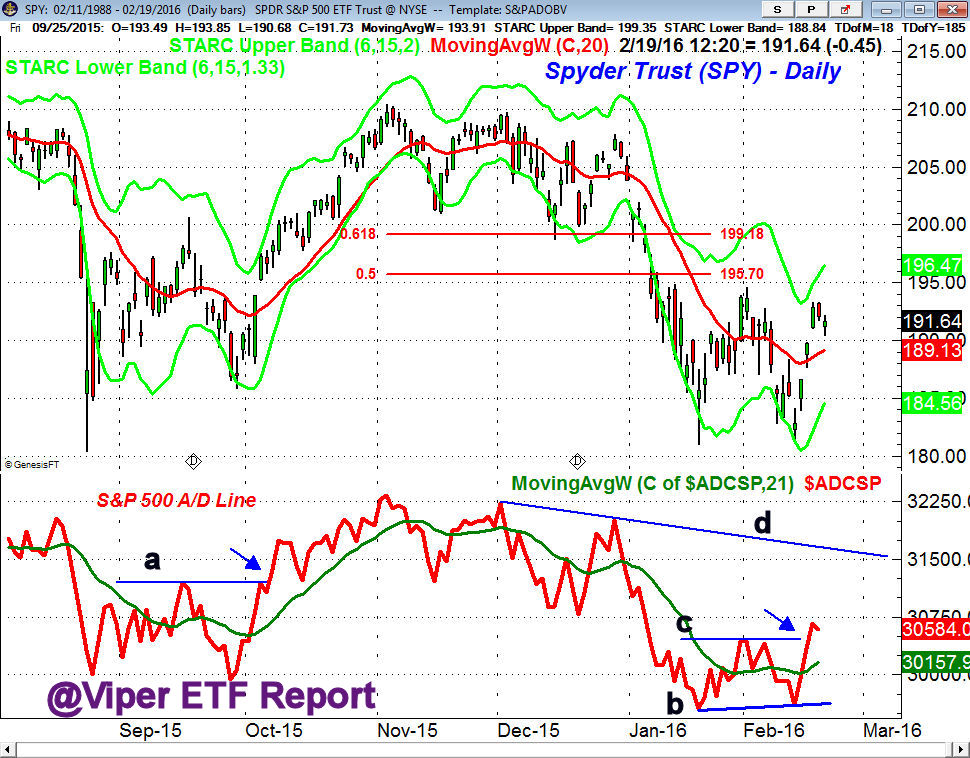
As regular readers know I use the market internals or the A/D line to determine the market's trend. By February 17th the bullish divergence in the S&P 500 A/D line (line b) was confirmed by the move above the resistance at line c. This signaled that the daily trend for the stock market was positive as was the case last October.
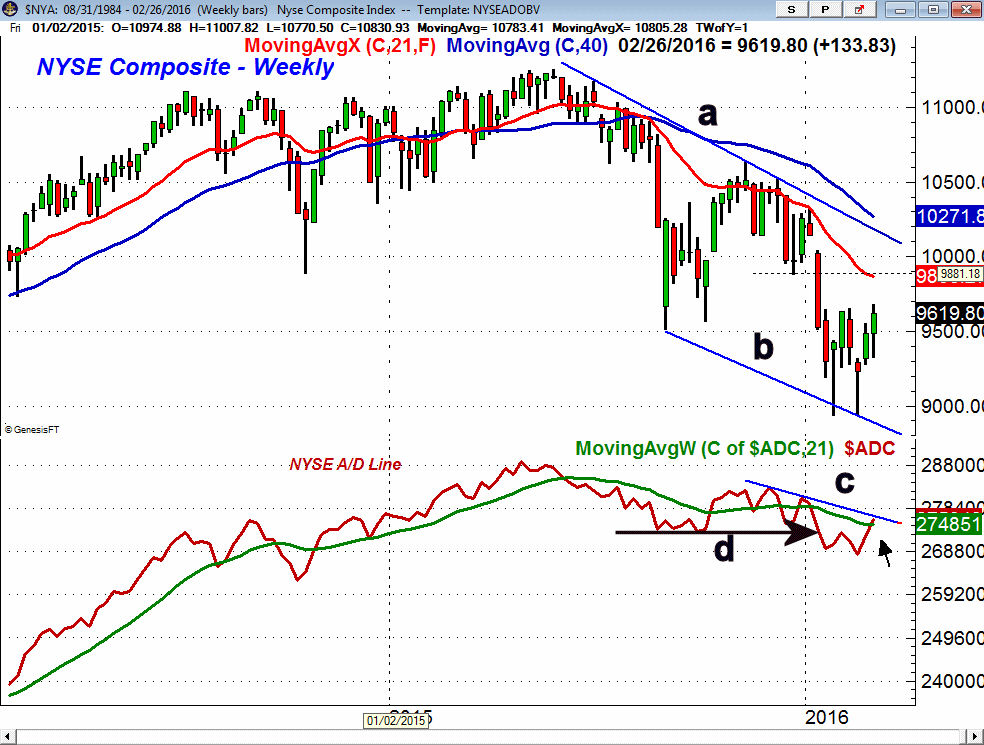
At my end of February column "Should Investors Ignore "The Wall of Worry"? I pointed out that "the weekly NYSE A/D line has moved back above its WMA for the first time since the start of the year. A higher close this week could move the A/D line through its downtrend, line c, which would be a sign of strength." The following week the downtrend was overcome and by the middle of April the NYSE A/D line had overcome the May 2015 highs which was bullish for the intermediate term trend.
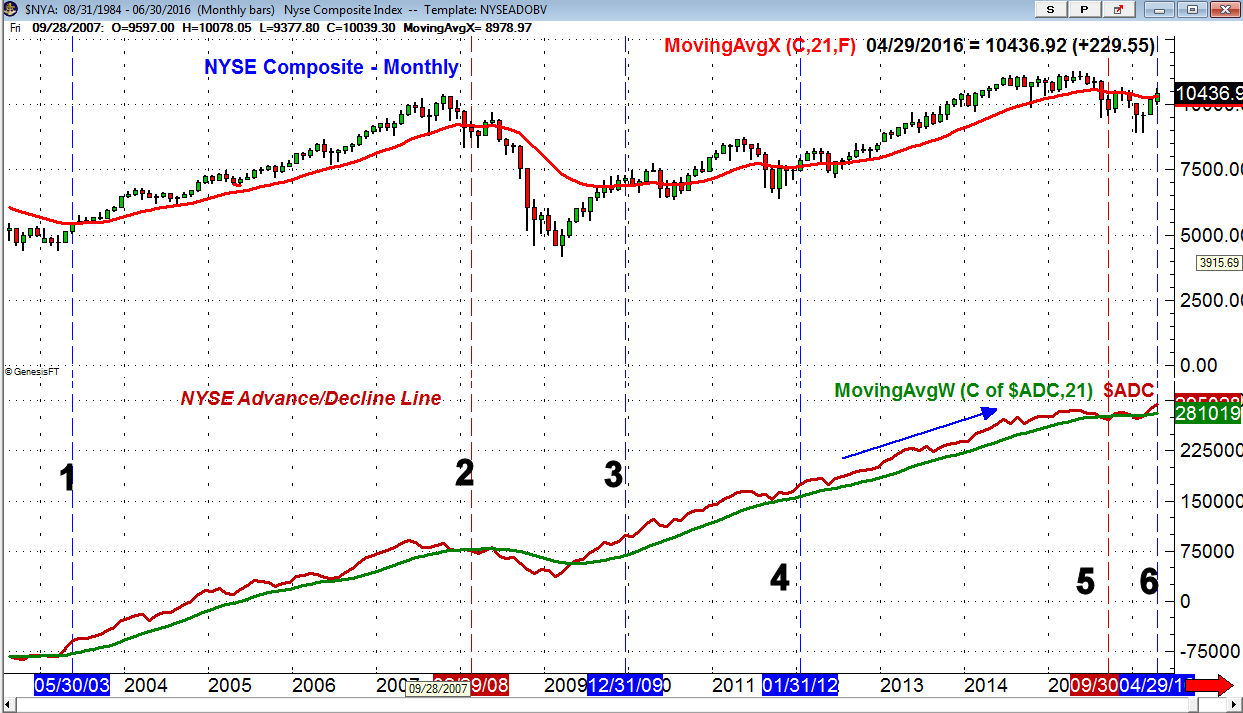
At the end of May there was another significant technical development as the monthly NYSE A/D line closed well above the monthly high from 2015, line 6. It has always been a very good indicator of the market's health. At the end of May 2003 the A/D line moved to a new high, point 1, signaling that the bear market from the 2000 high was clearly over.
The monthly A/D line continued to make new highs in 2004, 2005,2006 before it peaked in the summer of 2007. At the October 2007 highs the A/D line formed a negative divergence, line a, and subsequently dropped below its WMA. It stayed negative until May 2009 when it crossed back above its WMA. By the end of the year the A/D line had surpassed the 2007 high, line 3.
The monthly A/D line made new highs in early 2011 before it corrected back below its WMA. By the end of January 2012, line 4, the A/D line had again made a new high. It surged to new highs again in 2013 and 2014 before it peaked in May 2015.
Until last month the A/D had been in a year- long trading range which makes the May breakout even more significant. Each day I look at all of the major A/D lines and the current analysis is included in the Market Wrap section. To learn more about A/D line analysis read "One Indicator Stock Traders Must Follow".
The two technical studies that I find the most important for selecting stocks or ETFS are the relative performance and on-balance-volume analysis. This does take time as I look at the monthly, weekly and daily charts as part of my selection process. Since I routinely follow about 70 ETFS and over 150 stocks for my clients this does take quite a bit of time each weekend. It is included in Monday's reports and last week I had five new ETF buy recommendations.
If you are just starting the path to becoming our own expert or advisor I would recommend that you start out by following a small number of issues like the major sector ETFs and just 15 or 20 stocks. Once you get a routine established then you can gradually add to the number of issues you follow.
The Economy
Many investors who are worried about the health of the economy and future earnings were disappointed by the jobs report. It does make it less likely that the Fed will raise rates at their June meeting. As I pointed out last week investors should understand that historically stocks do well in the first year or so of a rate hike cycle.
I see no signs of a recession on the horizon but there are still a number of weak economic trends that I will be watching in the months ahead. For those that do not have the time to follow all the economic indicators I would suggest you focus on the Leading Economic Index. Last week's LEI chart pointed out that it typically tops out well ahead of a recession.
The manufacturing sector is the main concern as last Monday's Chicago PMI was below 50 at 49.3 and the Dallas Manufacturing Index dropped solidly back into negative territory. The PMI Manufacturing Index and the ISM Non-Manufacturing Index came in about as expected and are above the 50 level. The ISM has rebounded after being below the 50 level in late 2015 and early 2016.
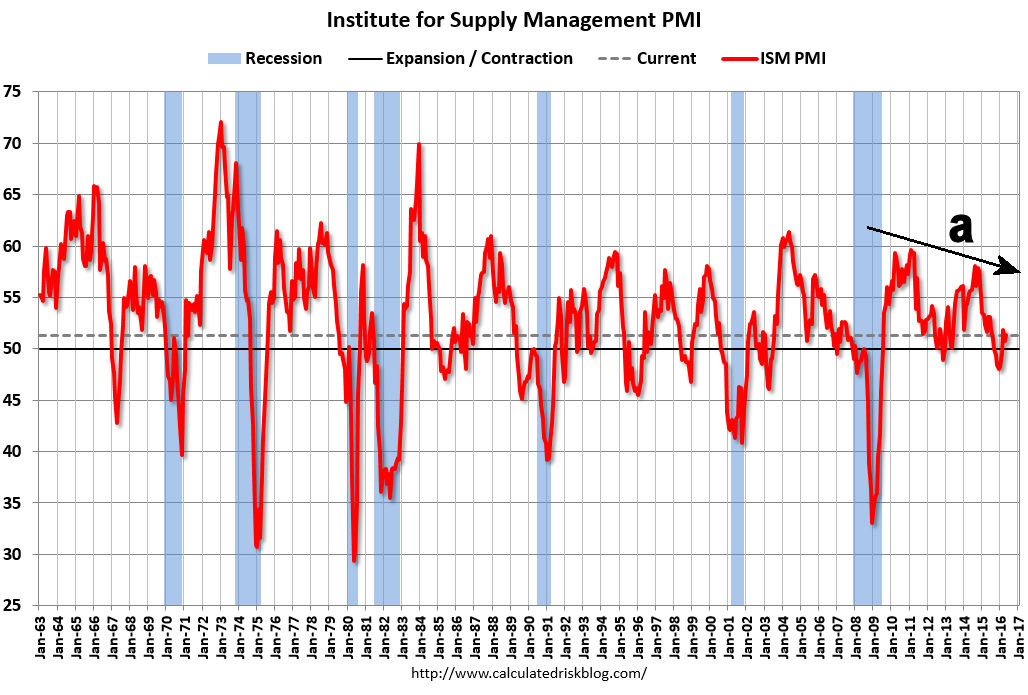
The long-term ISM chart shows how it has acted during the recessions going back to 1970. The lower highs in the ISM (line a) is a concern and it would take several months of much stronger data for it to break the downtrend.
The consumer confidence came in weaker than expected while the recent data on consumer spending shows a healthy increase. On Friday, in addition to the jobs report the PMI Services Index and ISM Non-Manufacturing Index were both weaker than expected in May as the ISM had a sharp drop of 2.8 points. Factory Orders and Construction Spending last week were also disappointing.
This week Janet Yellen is speaking on Monday followed by Productivity and Costs on Tuesday. The calendar is light with jobless claims Thursday followed by Consumer Sentiment on Friday.
Interest Rates and Commodities
Interest rates were a bit lower last week as they dropped in reaction to the weak jobs report. They are still locked in their trading range. The dollar index dropped in early reaction to the report but actually closed the day higher. The weekly studies on the dollar index have improved but have not yet signaled that an important low is in place.
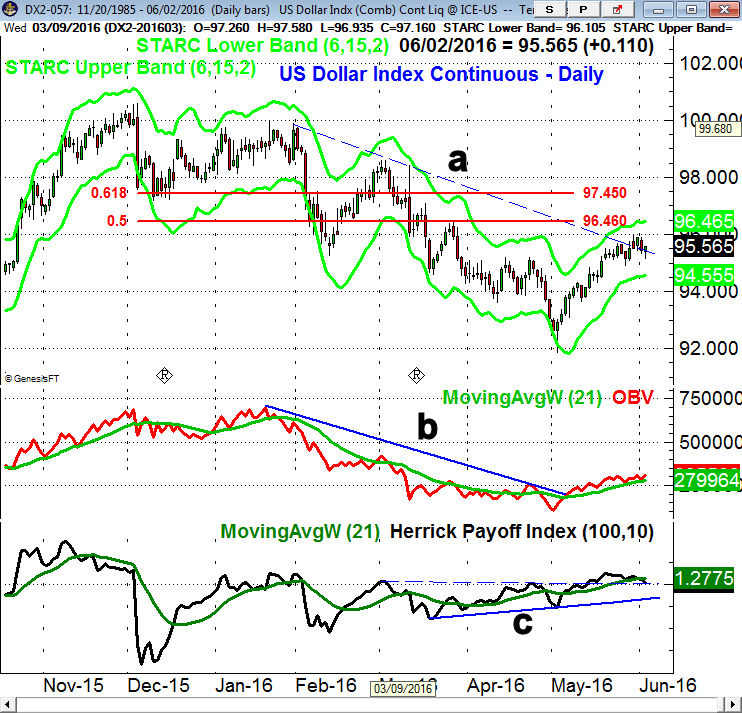
The daily chart of the dollar index shows that the downtrend, line a, was briefly broken last week as the 38.2% resistance was overcome. The 50% level is still higher at 96.46. A strong close above this level will signal a move to the 61.8% Fibonacci retracement resistance at $97.45.
The daily OBV broke its downtrend, line b, three days after the lows and is still holding above its WMA. The HPI did form a slight negative divergence at the highs early last week. It has dropped below its WMA but is still above the zero line and the support at line c.
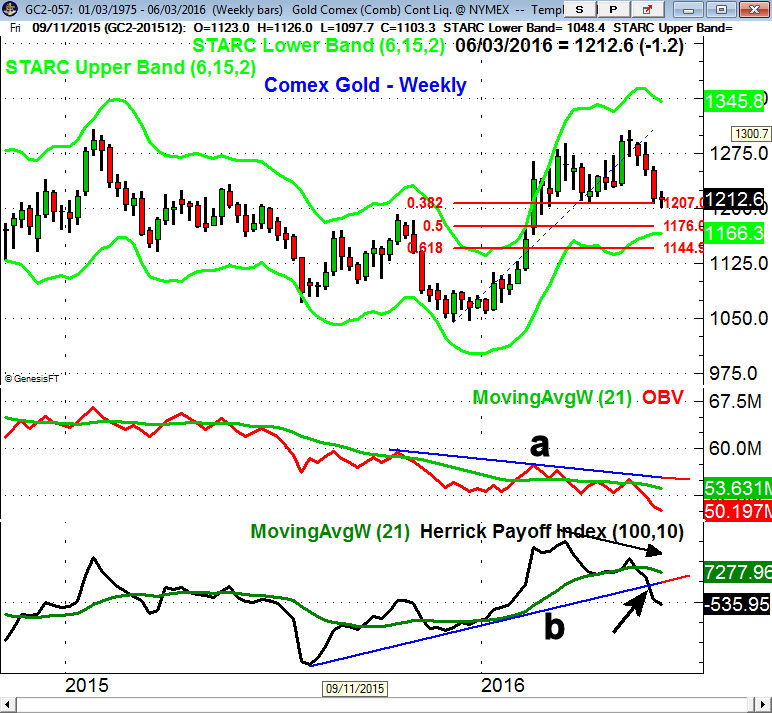
The Comex Gold futures dropped below the 38.2% support at $1207 last week but closed above the week's lows. The 50% support stands at $1176. The weekly studies are negative with the OBV dropping to new lows as the recent rally failed below the downtrend, line a. The HPI formed a negative divergence at the highs and has now dropped below the support at line b. The gold miners are acting much stronger as the GDX closed up over 11% on Friday.
Market Wrap
Friday's decline in reaction to the weak jobs report was well supported as the major averages closed well off the day's lows. The small caps bucked the trend last week as the Russell 2000 closed up 1.2% for the week while the S&P 500 was unchanged. The Dow Industrials and Transports were a bit lower while the Dow Utilities surged 2.45%. The A/D ratios were almost 2-1 positive and once again were much stronger than prices.
Health care and materials were the other top sectors last week gaining 1.5% and 1.3% respectively while the jobs report hit the financial stocks as they were down 1%. The technology sector and oil & gas stocks were also lower for the week.
There was a sharp change in bullish sentiment of individual investors last as the bullish% jumped 12.4% to 30.2%, according to AAII. This was a result of a switch from those that were neutral as the bearish% was pretty much unchanged. The VIX remains very low as it tried to bottom out as the market consolidated but failed to close above key resistance. The professionals seem to be predominantly bearish and it may take a close well above the all time high of 2135 in the S&P 500 to turn them around.

The NYSE Composite held above its 20 day EMA last week and looks ready to overcome the April high of 10,593. The monthly pivot résistance is at 10,738 (line a) with the May 2015 high at 11,254 which is 7.3% above Friday's close. On a drop below the recent low at 10,369 there is a band of strong support in the 10,000-10,200 area, line b.
The daily and weekly NYSE A/D lines made further new highs last week as both continue to lead prices higher. The daily A/D line is well above its rising WMA and so far has not seen much of a pullback. The McClellan oscillator dropped to a low of -204 as the market made its correction low but is still stalled below the resistance at +150, line d.

The weekly chart of the Syper Trust (SPY) shows that it is bumping into the May 2015 highs, line a. Once it is overcome the quarterly pivot resistance at $214.61 with the weekly starc+ band at $216.68. The width of the recent trading range has upside targets in the $218-$220 area. The mutli-year trading range has major upside targets as high as $240.
The weekly S&P 500 A/D line, as I noted at the time, broke through major resistance, line b, at the start of April. This completed the trading range, lines b and c, which strongly suggests that prices will also stage a significant upside breakout.
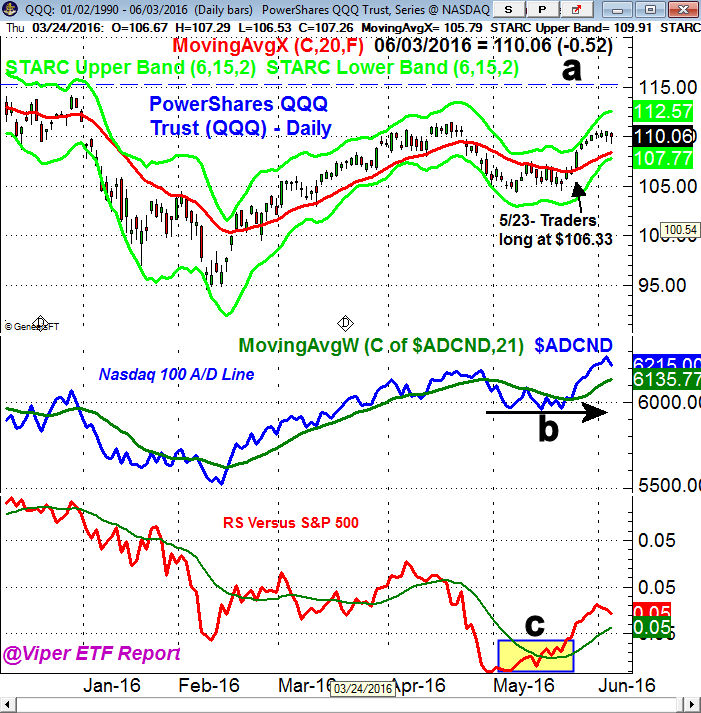
The PowerShares QQQ Trust (QQQ) topped out ahead of the other major averages in April and corrected sharply as Wall Street turned negative on tech stocks and Apple (AAPL). By May 18th the QQQ started to outperform the SPY as indicated by the highlighted area (point c). By the end of the week the Nasdaq 100 A/D line also showed signs of bottoming, line b. This suggested that the QQQ may have been ready to lead on the upside and new longs were recommended for Viper ETF traders.
The QQQ held up well last week as the early decline on Friday was well supported. Once above the April high at $111.44 the all time highs are in the $115 area, line a. The Nasdaq 100 A/D line made a convincing new high last week which does favor an upside breakout with next targets in the $120 area. The weekly RS line is back above its WMA but needs to move even higher to confirm that the QQQ is a market leader.
What to do? The fact the A/D lines ended their corrective phase on May 25th confirmed that stocks were starting a new rally phase. I was looking for a pullback last week but it was quite shallow in the SPY, QQQ and IWM. The technical evidence, despite the concerns over the economy and the weak jobs report, still favors even higher prices.
Very few analysts or investors are looking for sharply higher stock prices in the 2nd half of the year but I think it is a real possibility. I would not be surprised to see the S&P 500 reach the 2200 level and 2300 is a real possibility. This would mean a rally of 9.5% from current levels.
In April I suggested that those who were not investors should consider a dollar cost averaging program where six equal investments were made over a period of time. Those non-active investors should consider a broadly diversified ETF like the Vanguard Total Stock Market ETF (VIT) or the Vanguard MSCI Europe (VGK) which I have recommended in the Viper ETF report. They have yields of 2% and 3% respectively with very low expense ratios.
More active investors might consider either the Viper ETF or Viper Hot Stocks services. Reports are sent out twice a week and subscribers receive regular trading lessons. Each service is $34.99 per monthly and can be cancelled anytime. New subscribers receive the five most recent trading lessons.
Comments
comments