
The stock market had it sharpest selloff last Thursday since February 23rd as the stronger Japanese Yen and sharply lower Treasury yields spooked investors. The dollar dropped 1.4% versus the Yen as it has reached its highest level since October 2014. The dollar decline has caught many by surprise though there were clear technical signals by February 6th that the dollar had topped out. Many who sold the Yen short have been squeezed though there is still a high short position.
Despite the rebound Friday the major averages are still locked in their trading recent ranges. Many are wondering whether we are going to see a normal market correction after the recent 12% rally or will sector rotation will take its place.
Some of the strongest sectors like the Dow Transports have already corrected 5.7% from the March 21st high but there needs to be more evidence before I can conclude it has completed its correction. Positive signals a week ago put the health care, biotech and energy ETFs on the Viper ETF buy list last Monday and they all had a good week.
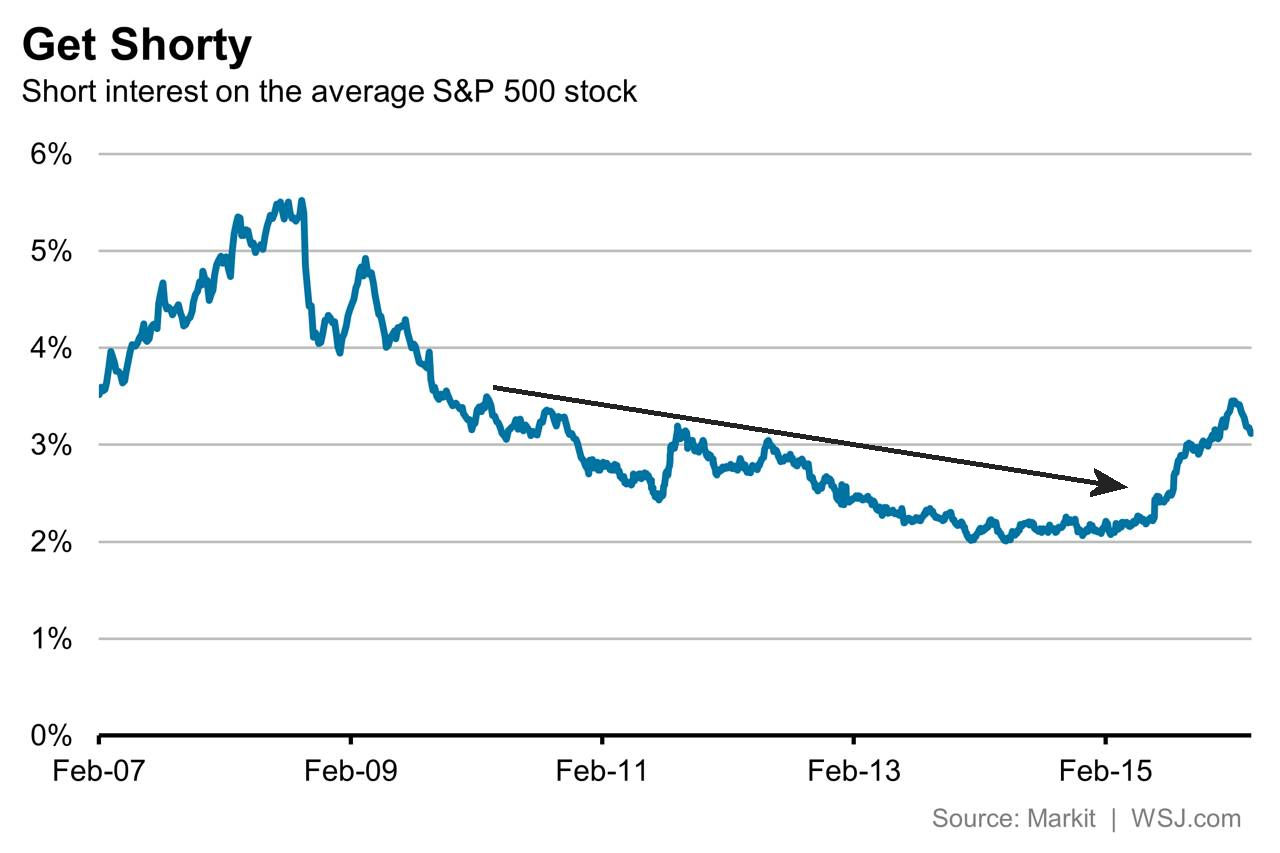
The markets are nervously waiting for the start of earnings season this week and by all accounts neither the investment pros nor individual investors are excited about the stock market. As noted in the WSJ last week the "Short interest, or bearish bets, on the average S&P 500 stock jumped to as much as 3.5% of available shares by mid-February". The chart is bullish suggesting the trend can continue even though it did pulled back to 3.1% recently.
There are other signs that money managers have not trusted the recent rally. A recent survey of active managers conducted by the National Association of Active Investment Managers (NAAIM) revealed that they only have a 68% allocation to stocks which is well below the 90% that they would typically have after such a strong market rally.
Much of the pessimism is tied to their expectations that we will have another weak earnings season. In last week's column "Should Investors Worry About Earnings Season?" I presented my view that the earnings season could be better than expected despite the widespread gloomy forecasts. I also pointed out that it was also not a reason for investors to avoid stocks.
In this environment the comments by Donald Trump last week that “I think we’re sitting on an economic bubble, a financial bubble" has likely made investors even more fearful. In my view this was goal of his comments. Unfortunately fear does sell which is demonstrated by the continued success of his presidential campaign.
Of course many others like David Stockman have been warning for years about the debt bubble and he has now come out with a trading service called "Bubble Finance Trader". Some may remember his March 2013 op-ed for the New York Times where he warned of a coming economic meltdown and advised investors “to get out of the markets and hide out in cash.” This column coincided nicely with the upward acceleration in stock prices as the Spyder Trust (SPY) was up 32.3% in 2013. Trump also warned Americans in 2013 "to prepare for financial ruin."
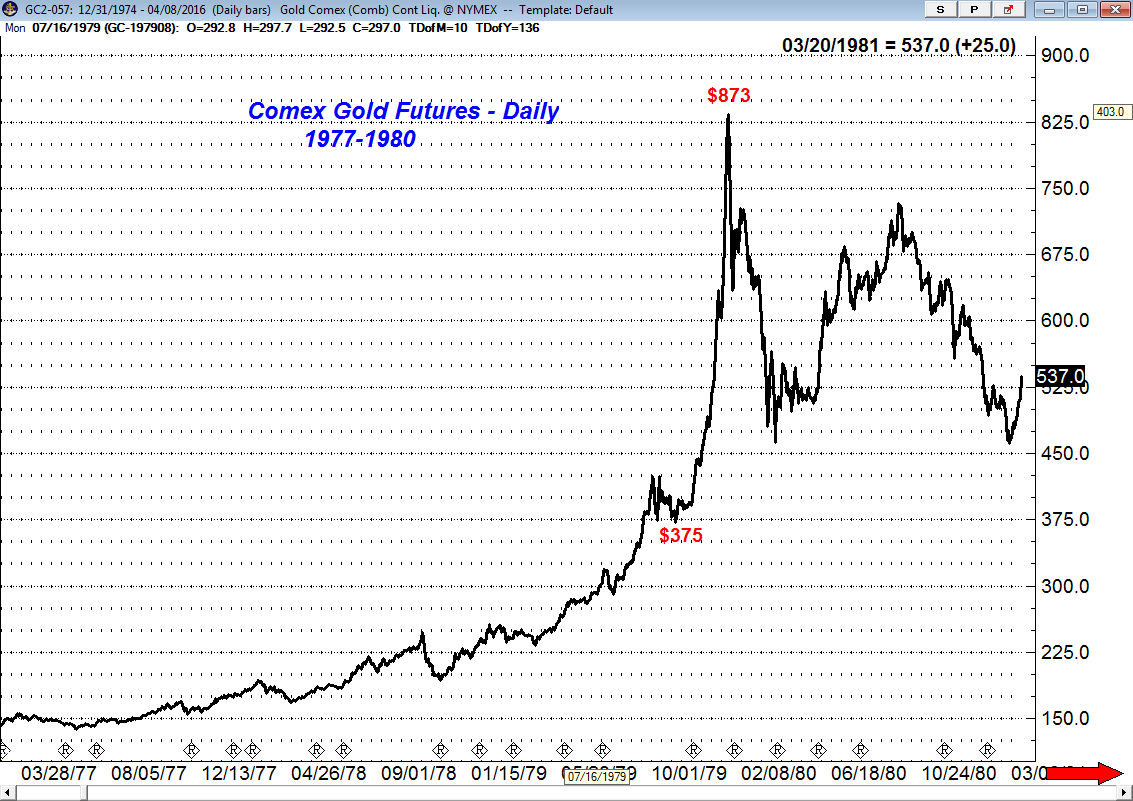
The first market bubble that I observed as an analyst was the rise in gold during the late 1970's and early 1980's. The rise from $375 to $873 per ounce between November 1979 and January 1980 in my view was classic bubble activity. Those of you who remember the markets at the time saw the public stampeding to buy gold and melt down any silver they owned as it had risen from $16 to over $41 per ounce. (More on Bubbles from PBS)
Now a downturn in the growth of global debt may at some point have dire consequences in my experience investors who invest based on long term macro trends generally miss out on some great opportunities. Many have missed much of the bull market performance because they listened to the warnings of a new recession or a Euro collapse ever time the market dropped.
In terms of the US stock market there are still no signs of a bear market so the bubble fears are likely to just be another reason for investors not to invest in stocks until the market is significantly higher. The comments by Trump likely spurred the reaction by the four living Fed Chairs who downplayed the chances of a bubble and the risks of an imminent recession.
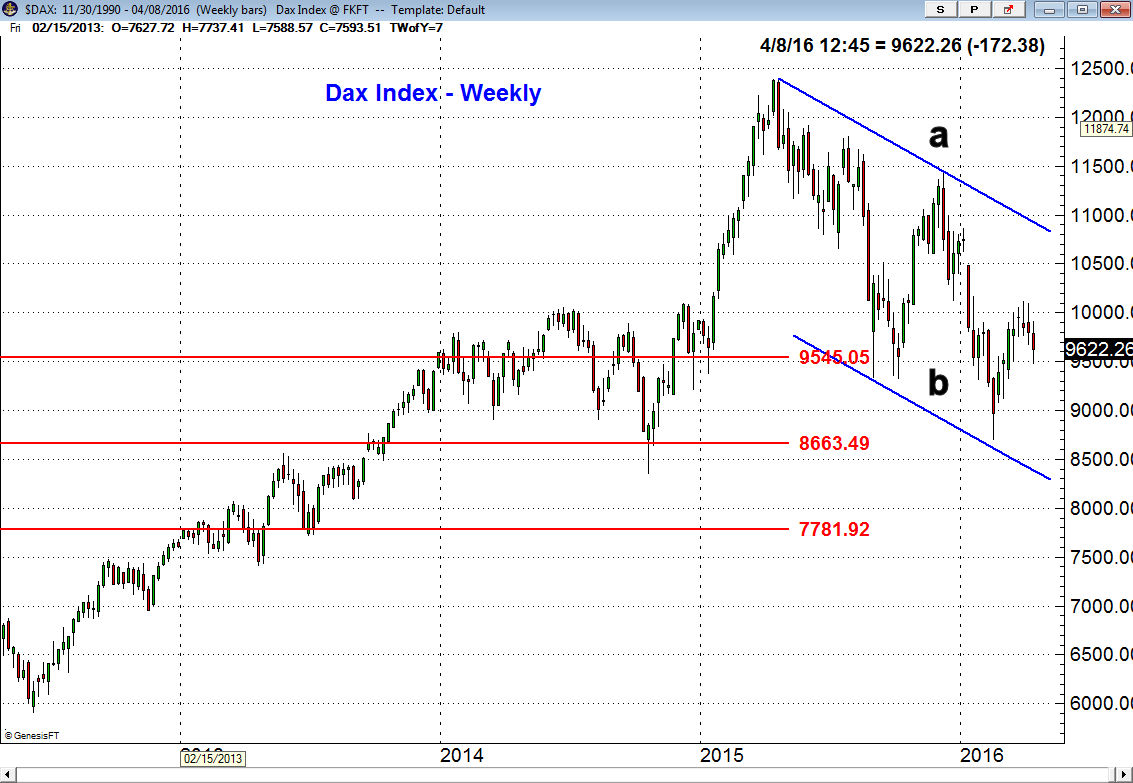
That does not mean that the markets will be easy over the next several weeks as I am still concerned that the Euro zone markets like the German Dax do not appear to have completed their bottom. A few weeks ago I pointed out that Dax had just rallied back to retracement resistance before it turned lower. The lower close last week reinforces the downward trading channel, line a and b. The Dax needs a couple of consecutive strong weekly closes to suggest that it has finally bottomed out.
The Economy
The economic calendar was light last week as the PMI Services Index was disappointing while the ISM Non-Manufacturing Index was much stronger than the previous month. The ISM report was consistent with solid growth for a large part of the economy. This is a positive for the economy in the months ahead.
Thursday's rather weak chain store sales in March are a concern though it may be due to the early Easter. These numbers could be an early warning for Retail Sales which will be reported this Wednesday. Also out are the PPI, Business Inventories and the Atlanta Fed Business Inflation Expectations.
On Thursday we get the Consumer Price Index and jobless claims followed on Friday by the Empire State Manufacturing Survey, Industrial Production and Consumer Sentiment.
Interest Rates & Commodities
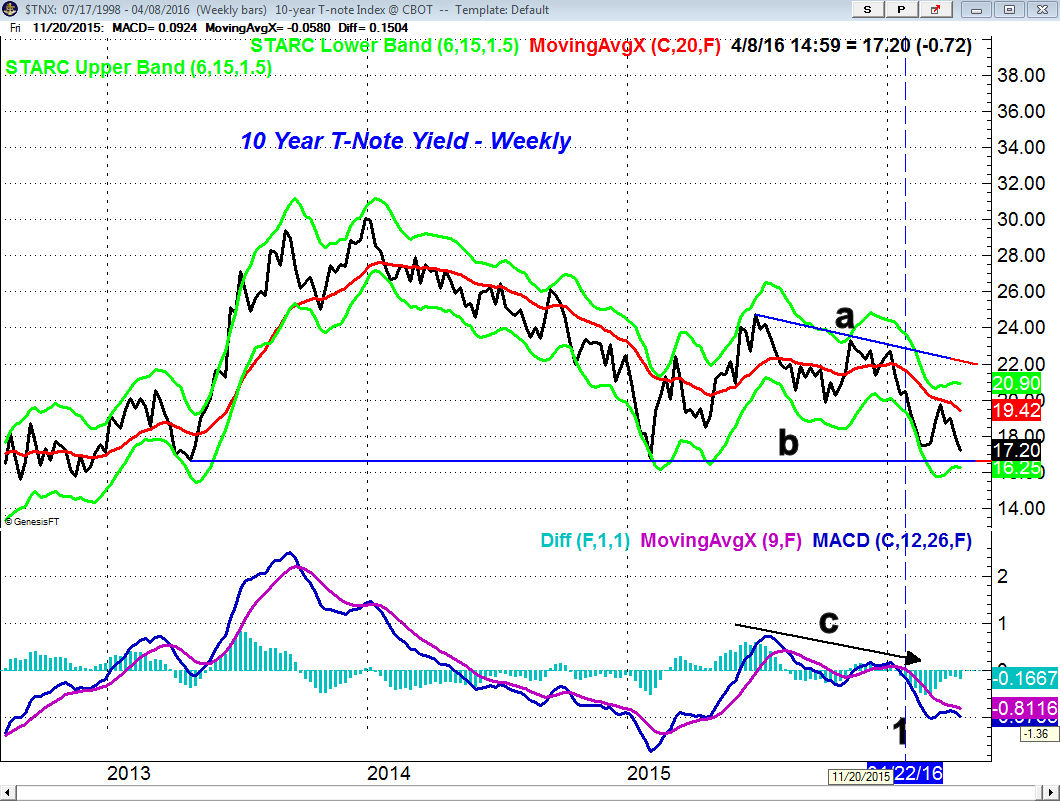
It was a wild week in the interest markets as the yield on the 10 Year T-Note dropped below 1.700% during the week, closing at $1.727%. The key weekly support still stands at 1.650%, line b. The weekly MACD formed lower highs at the start of the year (line a) and generated a sell signal on January 22nd, line 1. It is still negative which makes a break of the long term support and even lower yields quite likely.
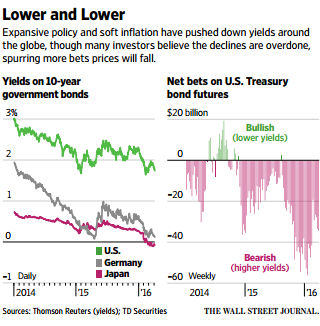
This WSJ table shows the wide gap between the yield on the US 10 Year and those from German and Japan where the yields are negative. If US yields do drop sharply it is likely to further add to the pain of the hedge funds and other traders.
The heavy short position in T-Bond Futures of close to $60 billion is evident on the chart. This could add to the pain of those who have fought the trend in the Yen and you will recall they were also on the wrong side of this market in the middle of October 2014.
Crude oil was up 6% on Friday spurring quite a rally in the energy stocks as those in the S&P 500 were up 2%. The rally in crude was fueled in part by a massive short squeeze as traders had increased their short positions by over 30% in the reporting period that ended last Tuesday.
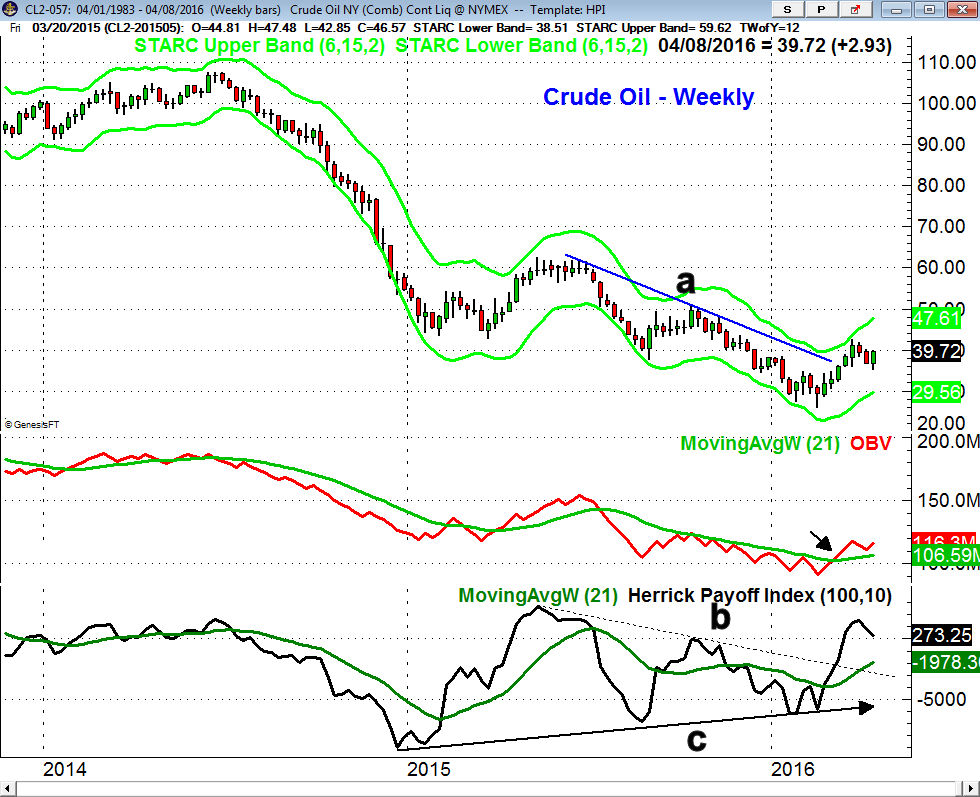
The weekly chart of crude oil shows that the downtrend, line a, was broken five weeks ago and the recent setback has not altered the positive technical readings. More importantly the on-balance-volume (OBV) had just pulled back to its WMA but turned higher with Friday's close.
The Herrick Payoff Index (HPI) has been indicating positive money flow since March 11th which is consistent with the breaking of the downtrend, line b. The HPI has also formed a long term positive divergence as it was making higher lows, line c, while crude was making lower lows.
It was my view in late January that energy stocks could help the stock market recover from its recent sharp slide and I still think this is very likely. In last week's column "Energy Pros Oil Picks Get A Technical Checkup" I took a technical look at some of the favorite picks from a panel of oil experts assembled by Barron's.
Market Wrap
There were few bright spots last week as the Dow Industrials and S&P 500 both lost 1.2% while the Dow Transports were down 1.9%. Small and mid-cap stocks did a bit worse and declining stocks led the advancing ones by 700 issues.
Only the oil & gas and health care sectors were higher with gains of 2.2% and 1% respectively. The financial stocks were the big losers down 2.6% and even the consumer goods lost ground as they were down 0.8%.
According to AAII the individual investor because a bit more bullish last week as the bullish % rose 5% to 32.2%, The bearish % is still quite low at 21.5% while the number of investors who are neutral is quite high at 46.3%.
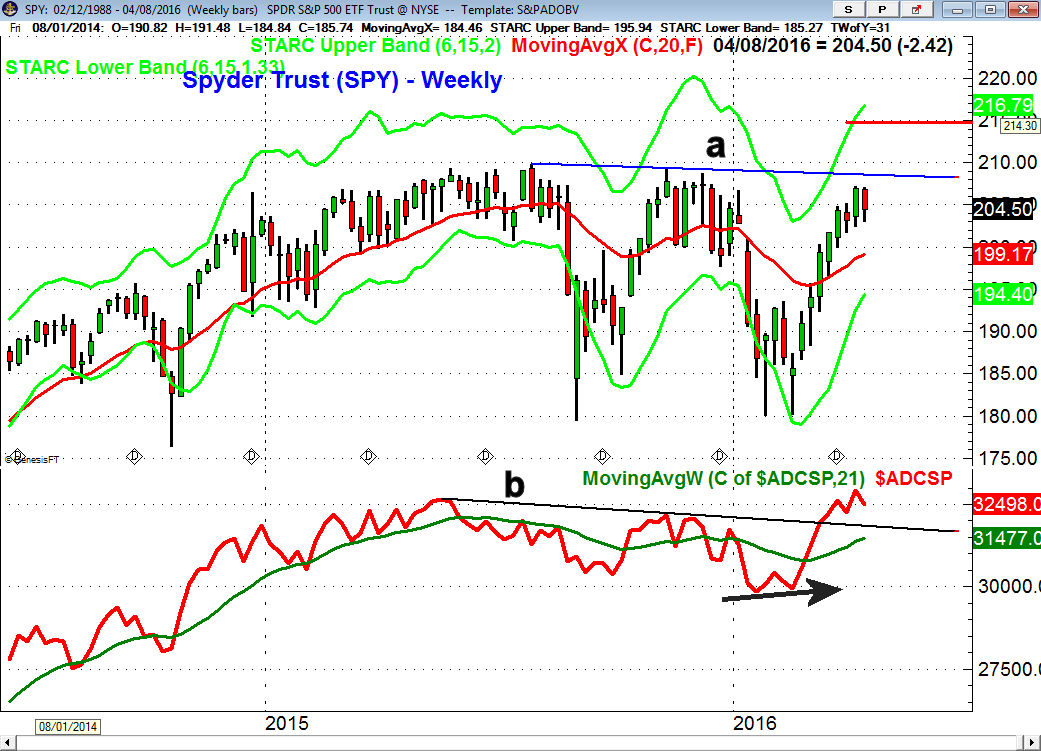
The weekly chart of the Spyder Trust (SPY) shows that the range last week was quite similar to the prior week with major resistance, line a, still in the $208-$210 area. The quarterly pivot resistance is in the $215 area.
There is initial support now in the $202-$203 area with stronger at $199-$200 and the still rising 20 week EMA. It will be important that SPY does not have a weekly close below the quarterly pivot at $197.50. The S&P 500 Advance/Decline line made a new rally high two weeks ago but turned lower this week. There is initial support at the breakout level (line b) with further at the rising 21 week WMA. The daily A/D chart (not shown) is still locked in a trading range.
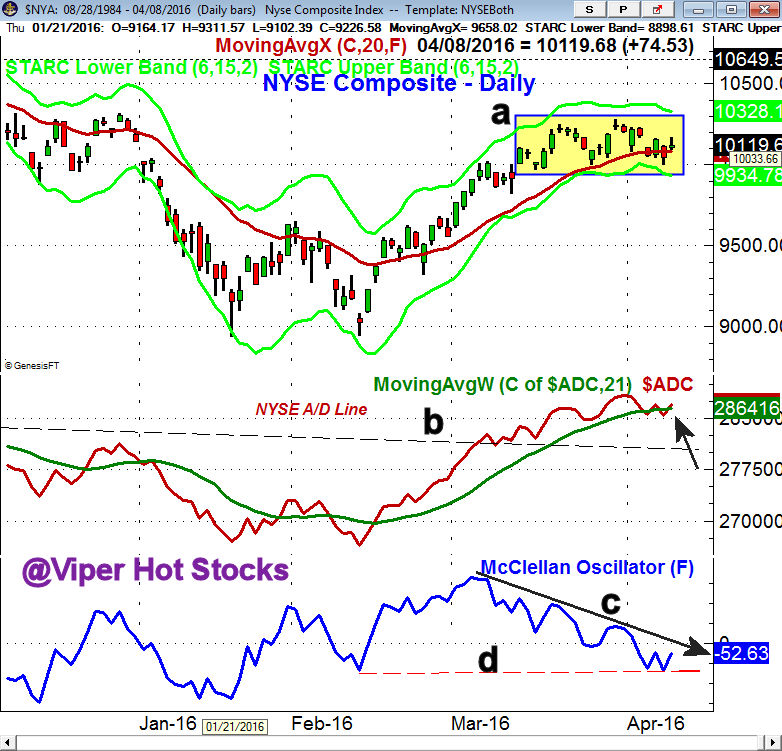
The NYSE Composite gained 0.74% on Friday and the daily A/D ratios were even stronger than prices as they were 3-1 positive. The daily chart shows that the trading range is still intact with resistance at 10,280 and support at 10,000. The NYSE was testing its 20 day EMA for much of last week.
The NYSE A/D line has moved back above its WMA and positive A/D numbers early this week will suggest a rally back to daily resistance and a possible upside breakout. The McClellan oscillator has been diverging from prices, line c, since early March. It is now trying to turn up from oversold levels , line d, but does not yet show a typical completed top formation. A new rally high would likely be accompanied by an even stronger divergence.
The PowerShares QQQ Trust (QQQ) was down 1.3% last week with the 20 day EMA now at $108.03. There is stronger support at $104.74 which is the quarterly pivot. The Nasdaq 100 A/D line did not make new highs last week and is now barely below its WMA.
The Russell 2000 small cap index was down 1.8% last week though the iShares Russell 2000 (IWM) is still in a short term uptrend. A close below $107 would break the short term uptrend and suggest a decline to the more important support in the $104 area.
What to do?
The market was nervous last week as concerns over global growth grew as rates in some parts of the world are negative. The focus this week will be on earnings but investors should note that there has been some improvement recently in the economic data. I will be watching the data closely in the months ahead for signs this positive trend has continued.
Despite the stock market rebound there continues to be a lack of interest in stocks by many investors. Those who started the year thinking there were going to invest in the market were quickly discouraged by the market's decline. Public warnings about bubbles and imminent recessions are also likely to keep many other investors out of the stock market.
It is the so called "wall of worry" that is a positive factor for the market's uptrend as it is only when everyone is bullish, as was the case in the fall of 2007, that the market gets into trouble. I see no signs of euphoria when it comes to investing though too many are likely over committed to the bond market. If we do get a sharp decline in US yields as the technical suggest investors should consider reducing their exposure.
Until we get clear signs of a daily top from the A/D lines a trading range seems the most likely scenario for the weeks ahead. Investors and traders have to pay attention to the entry levels as well as the risk on any new positions.
Those who jumped into the red hot iShares Dow Transportation ETF (IYT) three weeks ago are already suffering a 4% loss and it could still decline a bit further before the correction is over. There are no signs yet that the large diversified ETFs that focus on Europe or Asian have completed their bottom formation.
Most importantly the market is likely to have further sharp corrections in the next few months so develop a firm investment plan now so you do not react emotionally when the market drops.
Editor's Note: The ability to read the volume patterns in a stock or ETFs can often make the difference between success and failure. Tom will be teaching a two part interactive online class at end of April to a very small number of students. For more information - here is the link for the Secrets of Volume course.
Comments
comments