The stock market spent most of the week consolidating its gains after the sharp rally in reaction to the July jobs report. Thursday's sharply higher close and very positive A/D numbers suggests that stocks are likely ready for another push to the upside as the S&P 500 challenges the 2200 level.
The new high in the major averages and leading action of the advance/decline lines has still not convinced everyone as Goldman Sachs advised their clients on August 1st to "avoid all stocks for the next three months". They are also sticking with their yearend target for the S&P 500 at 2100 which is 3.7% below current levels.
It has not been a good year for Goldman Sachs as on February 16th they advised selling gold short when the December contract was trading at $1209. As of last Thursday's close at $1350 it is up 11.6% since this recommendation. Their crude oil forecasts also seem to be out of sync as they turned bullish three weeks before it topped out in June. As they continue to lay off staff I hope they consider hiring some good technical analysts.
There has been a shift in some of the market commentary as it is not nearly as negative on the stock market as it was in July. If the S&P 500 can close above 2200 I would expect to see a further reduction in the bearish commentary. There are still many bearish articles as mid-day Friday as one article advised to Sell Everything based on the following questionable bullet points.
- Our greatest investment minds are warning investors to avoid stocks and bonds.
- There are a multitude of fundamental reasons for this warning.
- Perhaps the most paramount of all is the issue of moral hazard.
Moral hazard - really? Looking back at the author's previous articles I found his February 25th 2013 article proclaiming it was still a secular bear market. The 53% gain in the Spyder Trust (SPY) since this article illustrates the danger of having an inflexible investment outlook and fighting the trend.
There was little change in individual investor sentiment over the past week as the bullish % just rose 1.5% to 31.3% while the bearish % was unchanged at 26.8%. The neutral camp at 42% is still quite high. The CNN Fear & Greed Index is still well in Greed territory at 76 as it has been for the past month or so but it is below the recent highs.
I have found this measure to be much better at market bottoms than at market tops. This is because when two of its components, stock price breadth and stock price strength, are very high my analysis indicates it is a sign of a strong as well as healthy market. High levels are not necessarily bearish unless they start to diverge and then turn lower. It should be noted that stock price breadth does not track the actual A/D data as it looks at the advancing and declining volume.
Put and Call option data is a contrary indicator as when too many are buying puts it is a sign that too many are bearish on stocks. Converesely a prolounged period were the call buying is much higher than the put buying it can be a negative. It is the change in their trends that indicates a market turn. This data is often quite early and option expert Larry McMillan last week commented that his analysis was now showing some signs of turning.
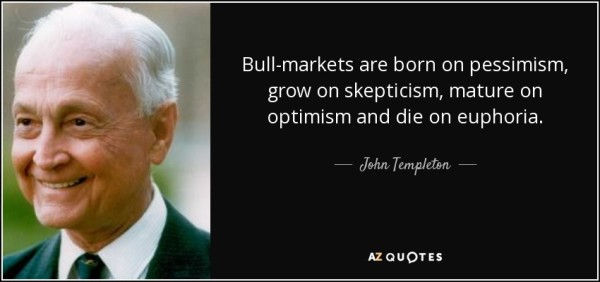
So what's missing from this bull market? Legendary investor John Templeton divided the bull market into four stages as indicated by his famous quote. In my view the prevailing sentiment from the market low in 2009, when pessimism was the highest, until early 2012 was one of skepticism. Many may recall that during the correction in the summer and early fall of 2011 many believed that the US economy had begun a new recession.
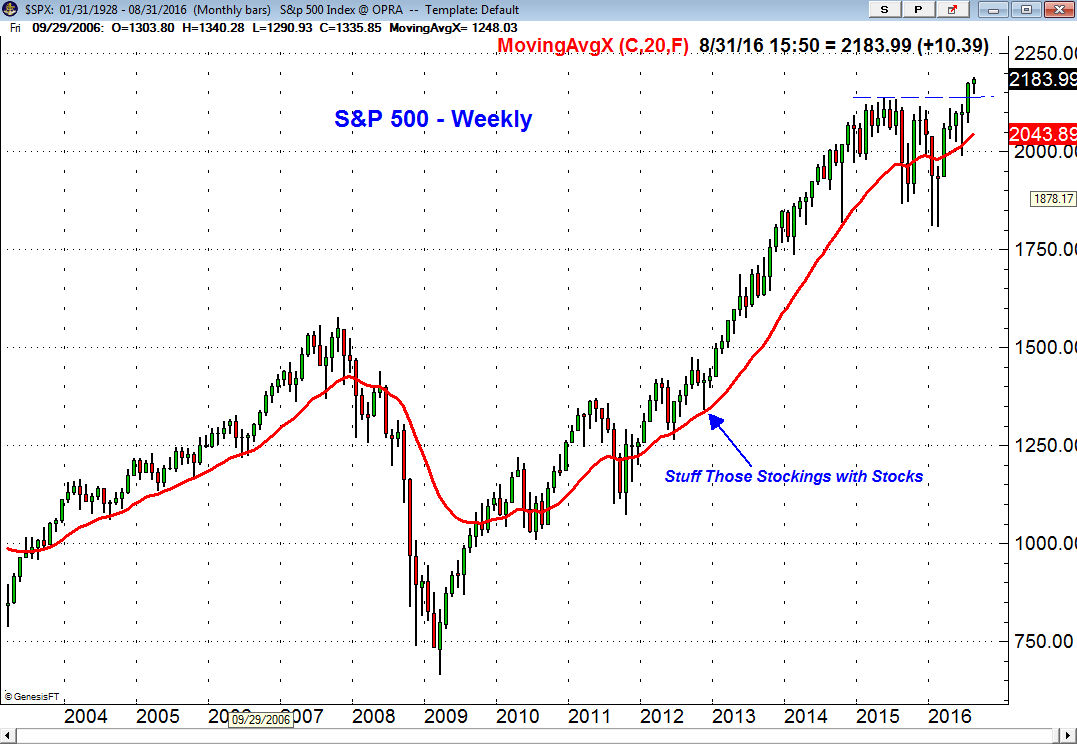
In 2012 there were few periods of sustained optimism as many feared that the Euro zone debt problems would cause a split and the US faced the fiscal cliff at the end of the year. Of course 2013 was the best year of the bull market as the S&P 500 only came close to its rising 20 week EMA in late 2012 just after the A/D line turned bullish by making a new high.
The S&P 500 stayed strong until the fourth quarter of 2014 when there was a four week 10% correction that dropped the S&P 500 back to the 1820 level . During this period there was a low level of investor participation as on Sept 8th a CNN article "More US families own cats than stocks" they reported that the Federal Reserve data indicated the "lowest level of stock ownership in 18 years".
At the time I did not think that this completed a major bull market top as historically major tops such as those in 1929 and 2000 have been accompanied by more investor participation and euphoria. This period could have represented the period of optimism but such a low level of individual investor interest was not consistent with stock investor euphoria.
Some noted analysts like Ed Yardeni in July 2014 felt that this was a period of stock investor euphoria and many feel the same way now. A Federal Reserve report from October 2015 stated that "fewer than 15 percent of U.S. households own stocks directly".
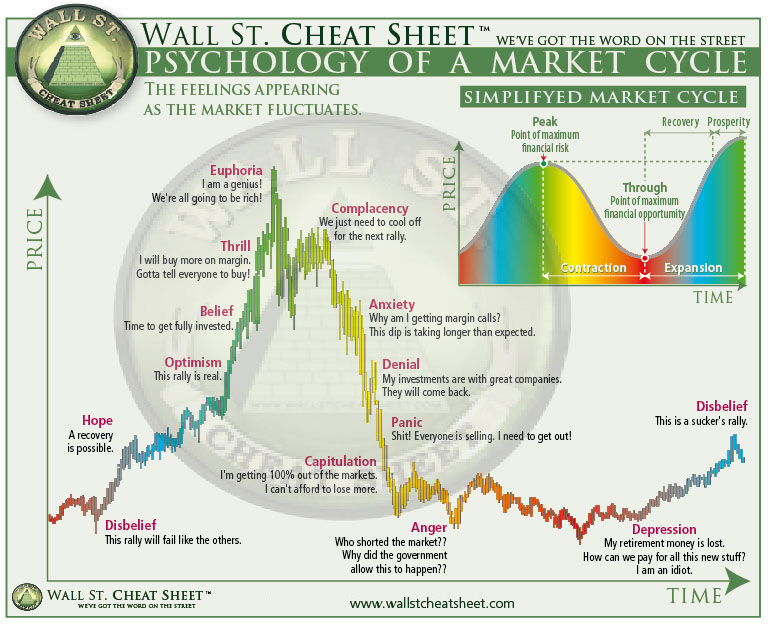
Psychology plays a major role in investing and there are a number of stages that investors typically go through. This is nicely presented in the graphic above from www.wallstcheatsheet.com and all investors should be aware of the various stages as they are often observed even on a short-term basis. Many went through the stages of panic, capitulation as well as depression last January and February.
If you are currently feeling quite smart because you have accumulated great profits since the market made its low in February (The Week Ahead: Is There Blood In The Streets Yet?) you may want to fight your current mood and take some profits now.
Even though I would not be surprised to see a near term market top in the next few weeks I think there are several sectors or industry groups that will come to the forefront as the market corrects. Last week the market was surprised by the double-digit gains in retail stocks like Nordstroms (JWN), Macy's (M) and Kohl's (KSS).
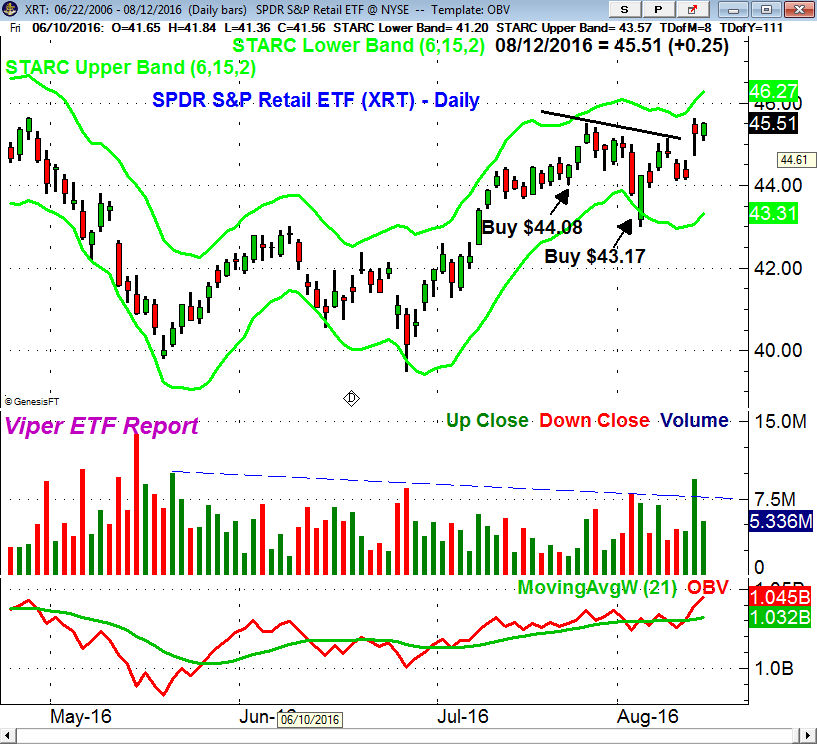
This helped confirm the bullish outlook for the SPDR S&P Retail ETF (XRT) which had been recommended to Viper ETF subscribers since the latter part of July. It broke out to the upside on Thursday ahead of the disappointing Retail Sales report. I find the supply/demand characteristics of industry groups and individual stocks are more reliable than any one monthly report. By monitoring the relative performance of all active ETFs the new market leaders are generally identified well in advance.
The Economy
The Retail Sales report was the most disappointing in a light week for economic data. The PPI was lower than expected as it was down 0.4% while the consensus was looking for a 0.1% gain. Business Inventories were up slightly while Consumer Sentiment was pretty much unchanged at 90.4.
The calendar this week is more crowded with the Empire State Manufacturing Survey and Housing Market Index are out Monday with the Consumer Price Index, Housing Starts and Industrial Production scheduled for release on Tuesday.
On Wednesday we get the FOMC minutes which are followed on Thursday by the Philadelphia Fed Business Outlook Survey and Leading Indicators.
Interest Rates & Commodities
The yield on the 10 Year T-Note dropped last week and it looks as though the rebound from the early July low weekly close at 1.366% could be over. A weekly close back below 1.458% will signal a drop back towards the recent lows.
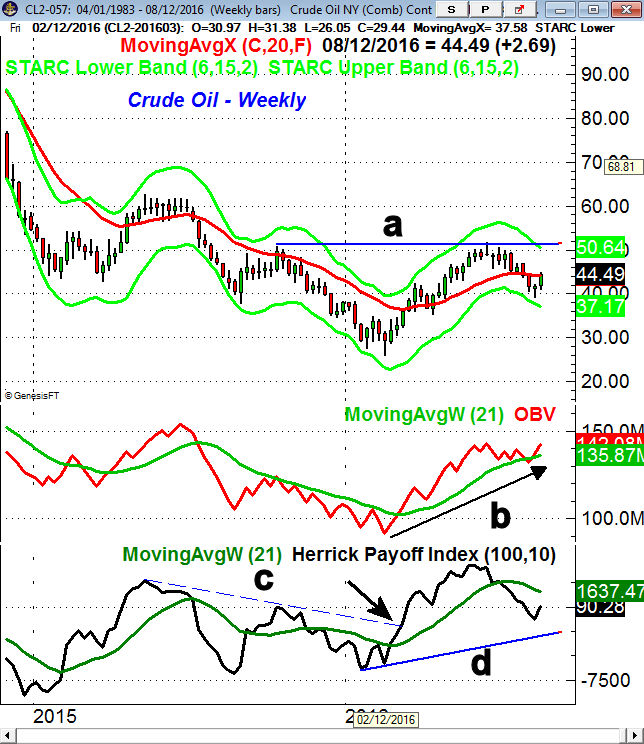
The strong 6.4% gain in crude oil last week is a strong indication that the correction is over. The weekly close above the previous week's doji high and the 20-week EMA are both positive signs. A weekly close above the resistance in the $52 area, line a, will complete a significant bottom formation. Viper ETF traders are long the SPDR S&P Oil & Gas (XOP) and will be looking to add to positions.
The weekly on-balance-volume (OBV) has moved strongly back above its WMA and is not far below the June highs. It is acting stronger than prices. The Herrick Payoff Index (HPI) which uses volume, open interest and prices broke its downtrend, line c, in March and then moved above the zero line. The HPI has turned up after its recent pullback and has strong support at line d.
Gold and the gold miners surged after the jobs report but failed to hold the gains at the end of the week. The Market Vectors Gold Miners (GDX) continues to act better than the SPDR Gold Trust (GLD) but the technical studies still indicate that this correction may not be over yet.
Market Wrap
The Nasdaq Composite, S&P 500 and Dow Industrials all had new closing highs on Thursday but overall the stock market closed the week mixed. The Dow Industrials and S&P 500 were just barely higher while the Dow Transports were down 0.75%. The Dow Utilities and the Nasdaq Composite were up slightly while the small cap Russell 2000 was down a fraction. The market internals were just slightly higher with 1681 advancing stocks and 1431 declining.
The oil & gas stocks were up 1.25% followed by a 0.74% gain in consumer service. The consumer goods, technology and industrial stocks were slightly higher. The materials stocks lost 1.2% followed by a 0.8% decline in health care and a 0.6% loss in the financial stocks.
In last week's Viper Hot Stocks scan of Nasdaq 100 and IBD top 50 stocks revealed many more new weekly sells than buys. Though my analysis of the advance/decline lines has not yet generated any warnings of a correction the increase in weekly sell signals meant that subscribers should be positioned on both the short and long side of the market.
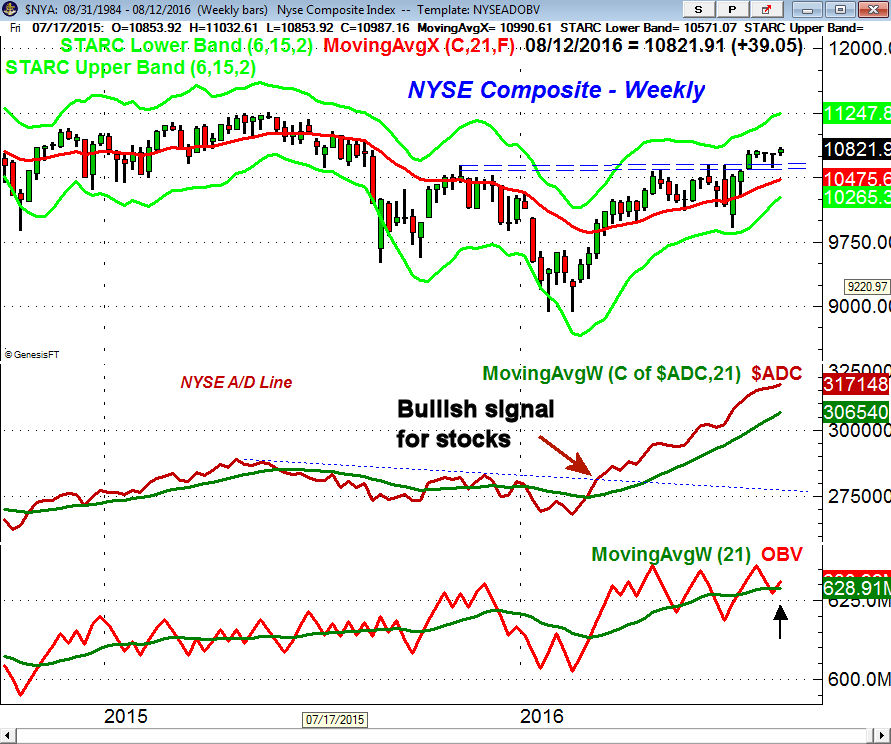
The weekly chart of the NYSE Composite shows a narrow range last week after testing the good support zone the previous week. Once above the 11,000 level the weekly starc+ band is at 11.247. The weekly NYSE A/D line made another new high last week and is still holding well above its rising WMA.
My NYSE A/D line analysis gave a bullish signal for stocks after the February low (see chart) and since then the NYSE Composite has gained almost 14%. The new multi-year highs in the A/D line does favor further gains in the NYSE Composite by the end of the year.
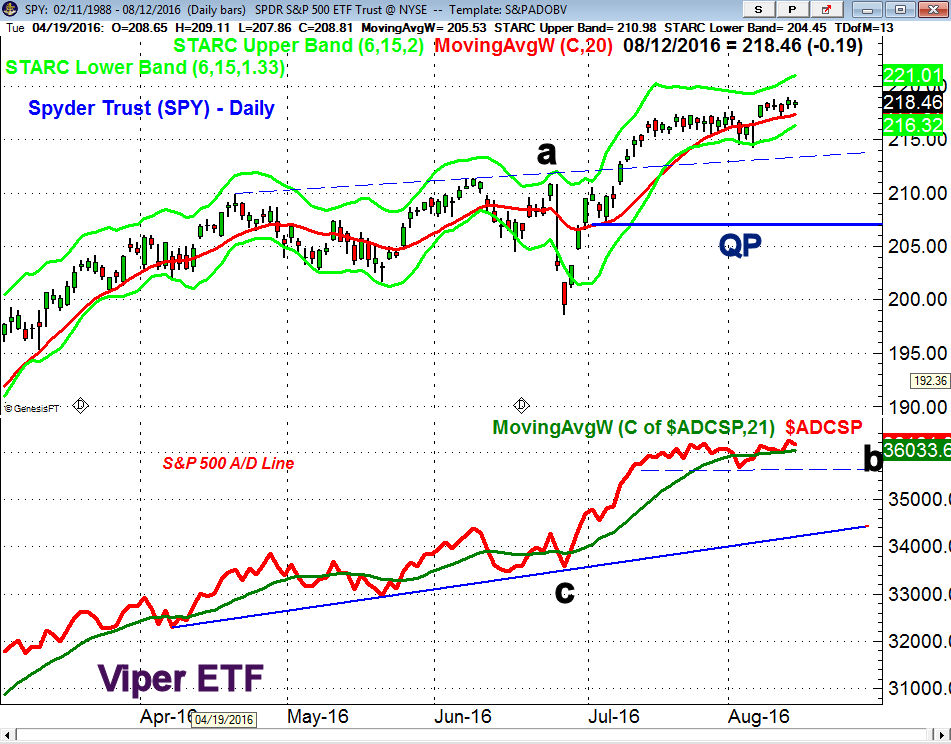
On the daily chart of the Spyder Trust (SPY) the upside reversal on August 4th (see arrow) was a sign that SPY was ready to resume its uptrend. It has been holding above its 20 day EMA at $217.37 all week. The quarterly pivot resistance is at $220.75 with the daily starc+ band at $221.01.
There is initial support now at $214.25 with further at $213, line a. There is more important support in the $210 area with the quarterly pivot (QP) at $206.88. A weekly close under this level would weaken the intermediate term trend.
A new trading lesson on quarterly pivot analysis was sent out to all Viper Report subscribers on Friday. It discusses how this methodology can keep you in the major trends. (It will also be sent out to all new subscribers to the Viper ETF Report or Viper Hot Stocks reports)
In terms of the relative performance analysis the weakest of the four market tracking ETFs is the SPDR Dow Industrials (DIA) while the PowerShares QQQ Trust (QQQ) and iShares Russell 2000 (IWM) are acting much better.
What to do? My analysis still suggests that the Spyder Trust (SPY) will test the $220 area but a day or so of very strong (3-1) positive A/D numbers is needed to indicate a move to the $222-$224 area. I still am recommending to subscribers that they scale out of long ETF positions in the SPY, DIA and IWM on strength as our stops have been raised as the market moved higher.
There has been further decrease in bearish sentiment but it may take a close above 2200 in the S&P 500 to convince more traders of the market's strength. For the past few weeks I have been recommending that now is a good time to weed out any market laggards from your portfolio. Those who have procrastinated should take the time this week to review your portfolio as there should be a better buying opportunity in next month or so.
The next correction could last a few weeks and it should provide a good opportunity for investors to add to their long positions. If the SPY is able to reach the $220 level then the correction could take it back to $213.50 if not the $210 area.
Those who are under invested in stocks should develop a plan to invest on the next correction as I do expect higher prices by year-end as they could rally 10% once the correction is over.
Comments
comments