

The stock market has had a crazy past two weeks after a very weak performance in September, where the Nasdaq Composite was down 5.2% and the S&P 500 lost 3.9% for the month. The stock market opened rough on Friday, October 2, with panicked overnight selling in the futures and stocks as traders reacted to President Trump’s COVID-19 diagnosis.
However, despite the frantic end to the week, the overall market remained strong, as there were three times more advancing issues on the NYSE and than there were declining ones. That is why I concluded last weekend that “as long as the market turns higher by the end of the week [of October 5], the intermediate trend will stay bullish.”
However, there was another news-related market decline last week, as President Trump ordered an end to negotiations over a new economic relief package. From a high of 3431.56, the S&P 500 dropped to a low of 3354.54 in the last 90 minutes of trading on Tuesday. The market commentary after the close was not optimistic, as this was the S&P 500's largest daily drop in almost two weeks.

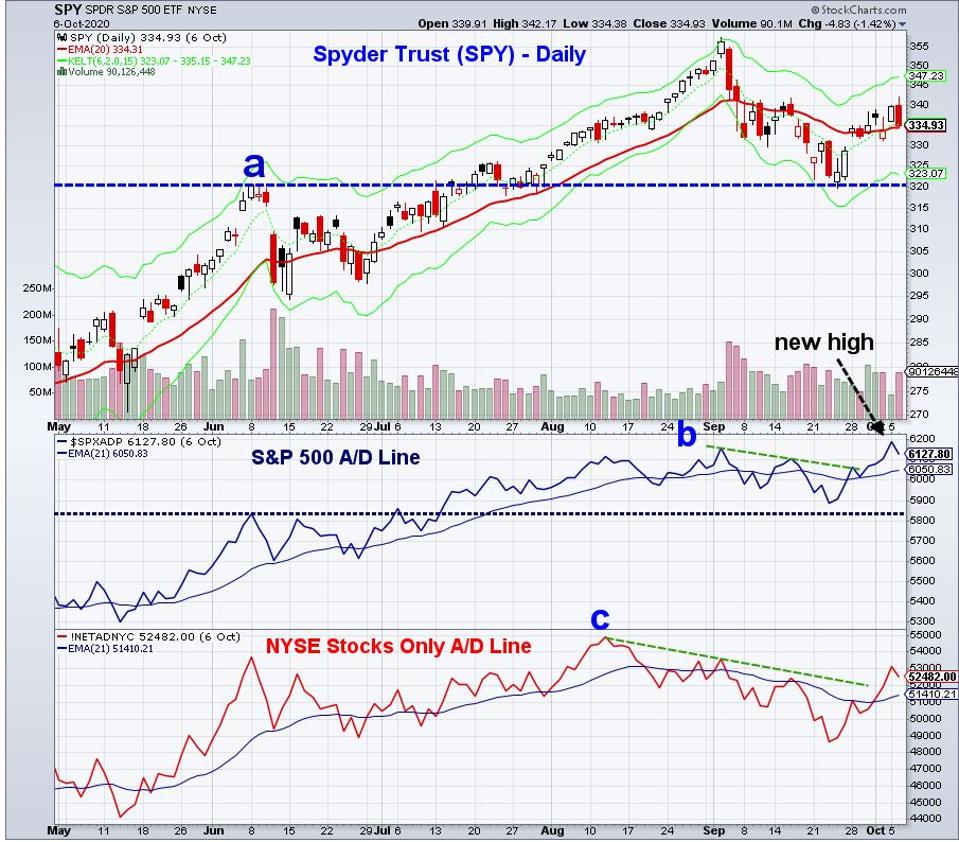
However, a longer view is necessary to diagnose the current market's trend. The above chart of the Spyder Trust (SPY) has data up through the close on Tuesday, October 6. As you can see, the SPY low from late September corresponded to SPY's high from June high (line a), which shows that resistance level became support.
The advance/decline numbers help to give an even better picture. On Wednesday, September 30, the S&P 500 Advance/Decline closed above its downtrend (line b), which was a sign that the correction from early September was over. Then on Monday, October 5, the S&P 500 A/D line made a new high which signaled that the S&P 500 will also make a new high.
The NYSE Stocks Only A/D Line peaked even earlier, on August 12, and made a significantly lower high in early September (line c) forming a downtrend as the SPY was making a new high. This downtrend was broken on October 2, as more stocks were advancing then declining, even while the market averages were lower. The NYSE Stocks Only A/D line is also now positive as it is well above its weighted moving average (WMA). However, it is still below the August high.

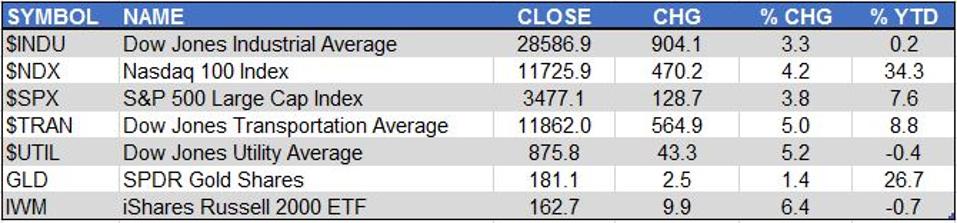
Given the positive readings from the advance/decline analysis, it is not surprising that the major averages finished higher last week, led by the 6.4% gain in the iShares Russell 2000 (IWM). Both the Dow Jones Utility Average and Dow Jones Transportation Average were up at least 5%. The Nasdaq 100, S&P 500, and Dow Jones Industrial Average all saw gains in the 3.0-4.5% range.

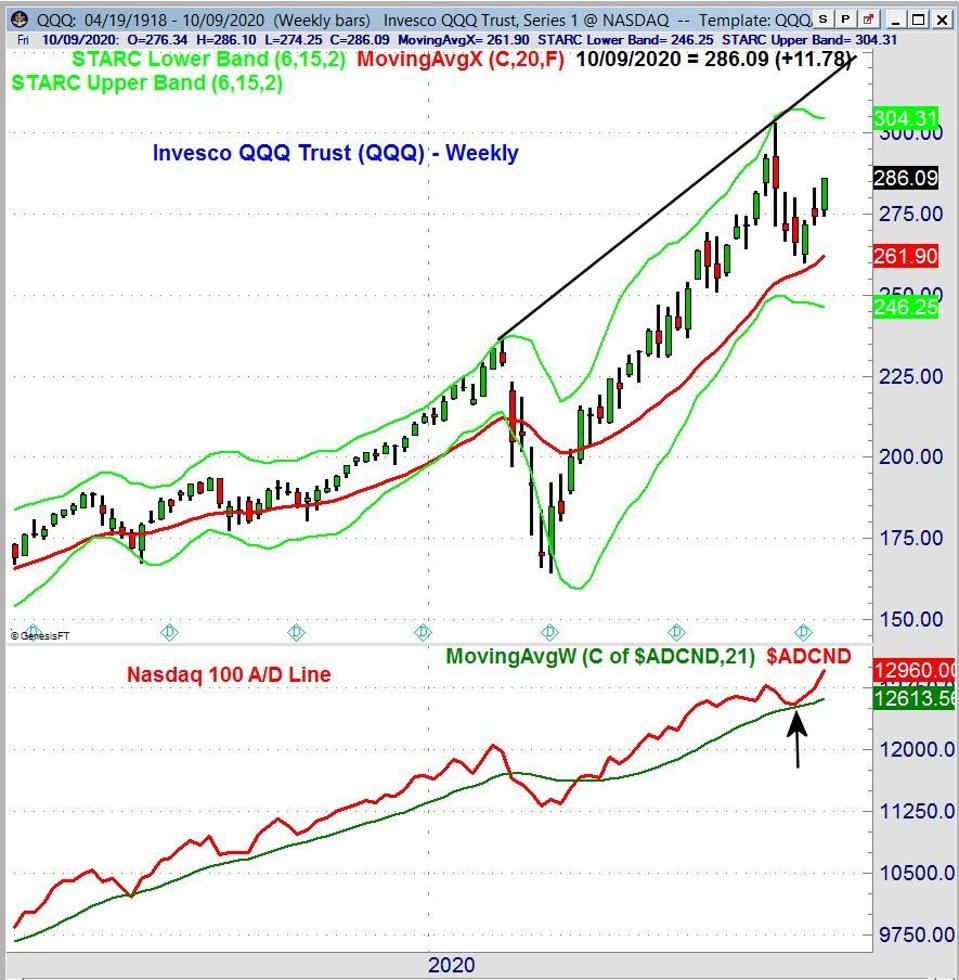
The Invesco QQQ Trust (QQQ), which tracks the Nasdaq 100, fell very close to its rising 20-week exponential moving average (EMA) three weeks ago, having declined 14.2% from the September high of $303.26. It then closed the week high.
It was also a positive sign that the Nasdaq 100 A/D line turned higher that same week, and has now made a convincing new high. This is an indication that the QQQ will also make a new high even though as of Friday’s close it was 5.6% below the September high.
The two top sector ETFs last week were the Materials Sector (XLB) and Energy Select (XLE), which were both up 5%. More impressive was the over 7% gain in the SPDR S&P Bank ETF (KBE) and SPDR S&P Regional Bank ETFs.

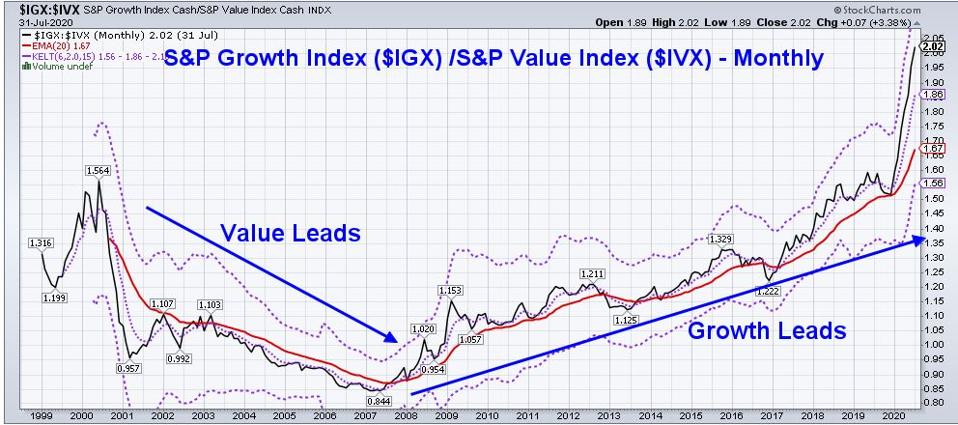
This help stimulate a number of discussions in the financial media as to whether it was finally time for value stocks to lead growth stocks. This monthly chart is of the spread between the S&P Growth Index ($IGX) and the S&P Value Index ($IVX), going back to 1999. When the ratio is rising, growth stocks are outperforming value-based ones, and when it is falling, value stocks are stronger.
The spread peaked in June 2000 at 1.564, and bottomed in May 2007 at 0.844, as value stocks led growth stocks over that period. Growth bottomed before the bear market ended in 2009. Since late 2019, the spread has accelerated to the upside as growth has outperformed value in a spectacular fashion. This long term chart shows no signs yet of a change in trend, even though it appears quite extended.

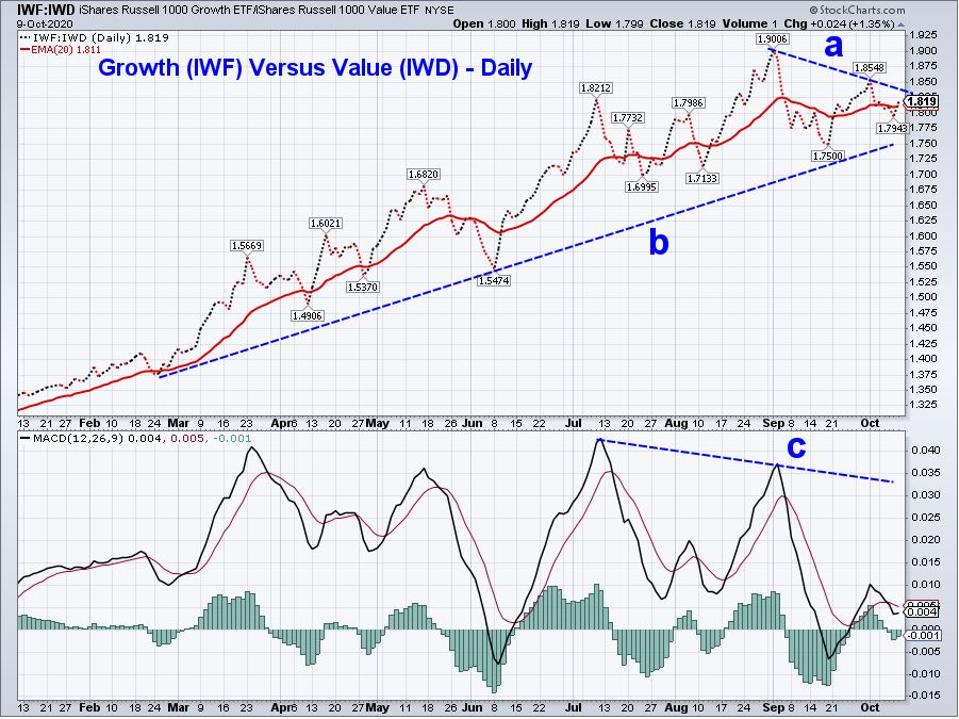
Another way to look at this relationship is by comparing the iShares Russell 1000 Growth (IWF) to the iShares Russell 1000 Value (IWD). This spread peaked on September 1 and declined 7.9% to a low of 1.750 on September 18.
A move above the October 1 close of 1.8548 and the downtrend (line a) should be a signal that growth is again leading value. If instead the spread drops below the support (line b) and the July low of 1.6995, that will be a positive sign for value stocks.
The daily Moving Average Convergence-Divergence (MACD) lines are negative and formed lower highs in August (line c). That was also the case in May, when value had a nice rally versus growth, before growth resumed its upward trend. A move in the MACD lines above the October 1 peak will favor growth over value.
Yields last week were higher, as the 10 Year T-Note exceeded the highs of the past sixteen weeks, closing at 0.775%. The June high was 0.957% which is now the level to watch. Early this coming week, we get the CPI and PPI, while later in the week including the Philly Fed, Empire State Manufacturing, Retail Sales, Industrial Production and Consumer Sentiment
Going off of the A/D line analysis, the outlook is still bullish, as the correction from early September appears to be over. The news-related market declines of the past two weeks have created some good buying opportunities. As the market moves higher and the election nears, I think more such declines are likely, allowing for a few more good opportunities to buy at support.
In my Viper ETF Report and the Viper Hot Stocks Report, I update subscribers with market analysis twice per week, along with specific buy and sell advice. Each report is just $34.95 per month. New subscribers also receive six free trading lessons, a $49 value.
Comments
comments