

The nervousness over the FOMC meeting was not warranted as stocks rallied nicely on Wednesday and continued sharply higher for the rest of the week. The five consecutive weeks of strong market action has confounded many market professionals and has further frustrated investors.
The severity of the drop did create a massive change in sentiment and pushed many market measures into extremely oversold territory. This did not make it any easier to ride out the push to the downside on January 20th. Some money managers are now relating how difficult it was to hold their clients hands during the market's decline.
After the market bounced from the January lows I concluded that "The majority of traders are still looking for a break below 1820 in the S&P 500 so a rally that lasts longer would not be surprising.
Technically it seems as though the stock market needs more time to repair the technical damage so once the current rally tops out then the market could drift back towards the January lows. This could complete a more sustainable market bottom ..."
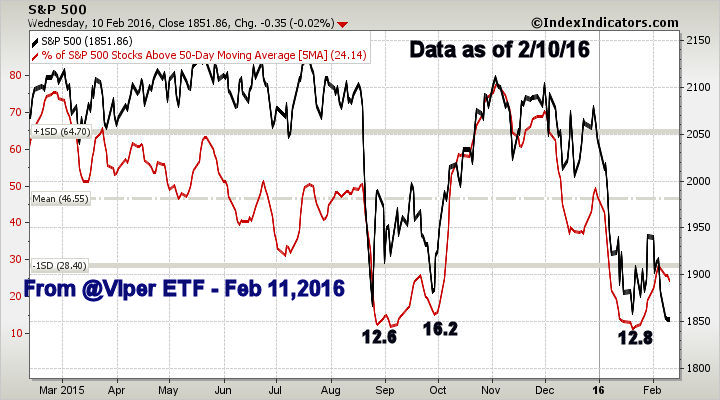
It was the new correction lows on February 11th that finally completed the market's bottom and one indicator that I focused on the time was the divergence in the 5-day MA of the % of S&P 500 stocks above their 50 day MAs.
The top chart from Viper ETF Report shows that on February 10th it was at 24.1% well above the January 19th low of 12.8%. This divergence, combined with the positive signals from the McClellan oscillator (see chart), the sentiment readings and NYSE H/L analysis indicated that the market was ready to turn higher.
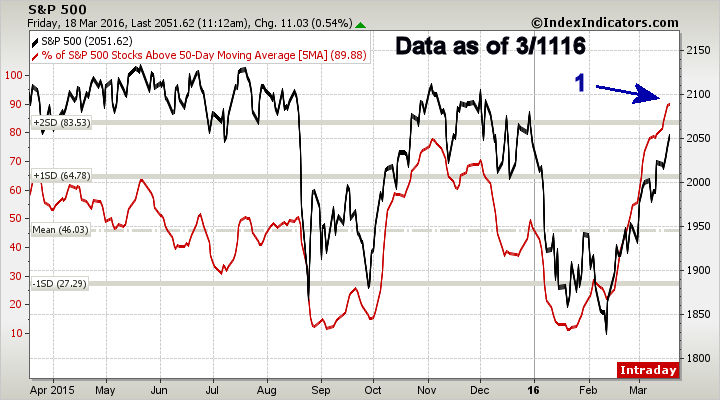
The updated chart (on the bottom) shows that % has now risen to 89.88% which is the highest reading since November 2014. Four weeks after it peaked the Spyder Trust (SPY) had a two week, 5% correction. As I discuss further in the Market Wrap section this one of the factors that has me looking for a correction.
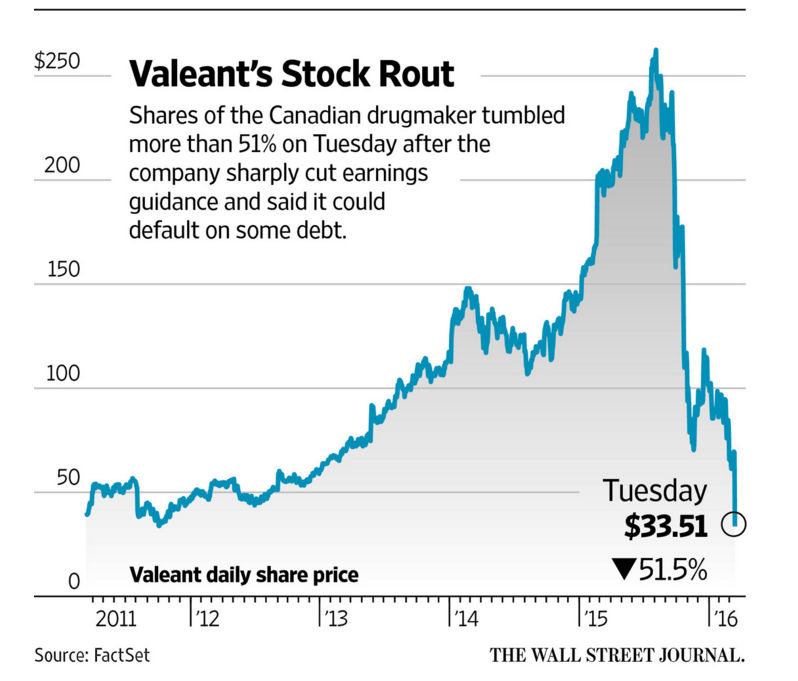
As the market was moving higher all week the focus of many investors was on the meltdown in Valeant Pharmaceuticals (VRX). The company slashed earnings guidance and acknowledged that they were still unable to file their annual report with the SEC. The stock dropped 51% last Tuesday.
As I pointed out in October 2015 I thought it was it inexcusable for any investment professional to allow one stock make up a large percentage of their portfolio. I was appalled to learn that the highly touted Sequoia Fund (SEQUX) had almost 1/3 of their assets in VRX. Pershing Square Capital Management's Bill Ackerman had to spend several hours explaining his $4 billion investment in VRX. He was on the hot seat again last week as were other large VRX investors.
In the past year SEQUX is down 23.9% and in a Forbes article last week it was noted that " In total, the four major investors in Valeant—ValueAct, T. Rowe Price, Pershing Square Capital Management and Ruane Cunniff & Goldfarb, suffered a combined $3.66 billion in paper losses on Tuesday."
It was also surprised to learn last fall that Sequoia Fund (SEQUX) was still being recommended by some advisors and was highly rated by Morningstar. Though I have great respect for their analysis they failed to review their ranking until last week.
I hope this sends a powerful message to investors that you should always know what you are buying. Take the time to determine the holdings of any mutual funds or ETFS that you are considering. If you are working with an advisor who recommends a fund, ask them if they have closely looked at the fund’s holdings. Their answer should help you decide whether you have the right advisor.
As part of my analysis routine I look at the holdings of an ETF before it is recommended to clients of my Viper ETF Report . Some of the ETFs that I follow like the Energy Sector Select (XLE) are not my first pick in the energy space because they have 19.9% holding in Exxon Mobil (XOM).
This is in contrast to the SPDR Oil & Gas Exploration (XOP) whose largest holding is 3% in Cabot Oil & Gas (COG) with just 2.6% in XOM. With the internet it is easy to find this information quickly so I hope all investors and traders will take the time to do your own research.
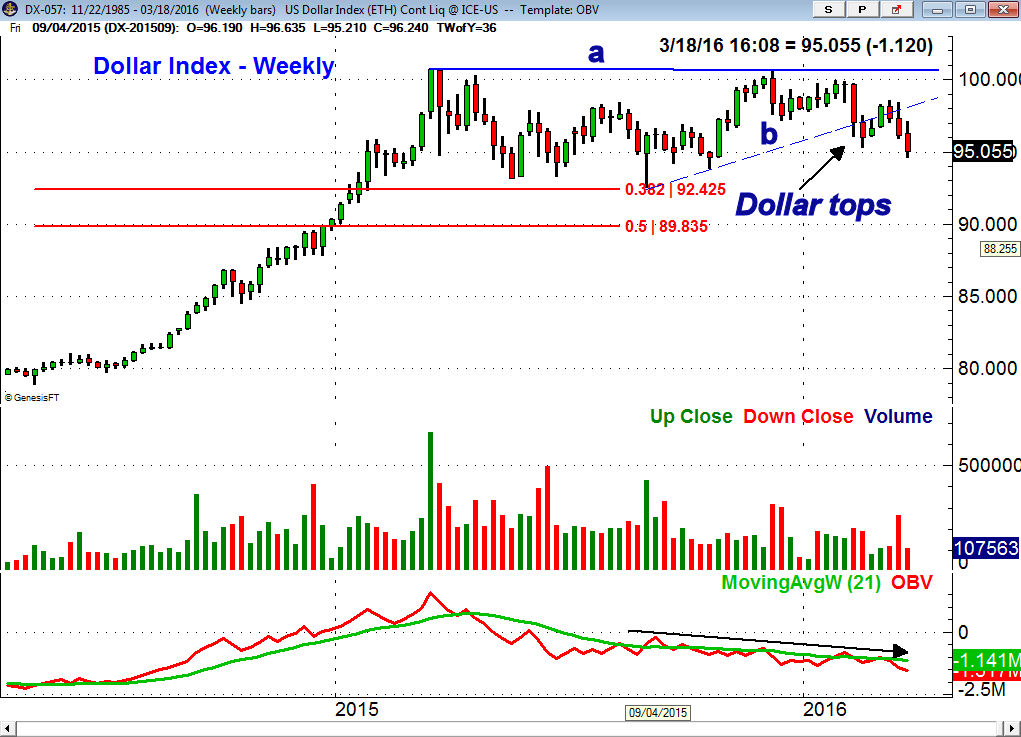
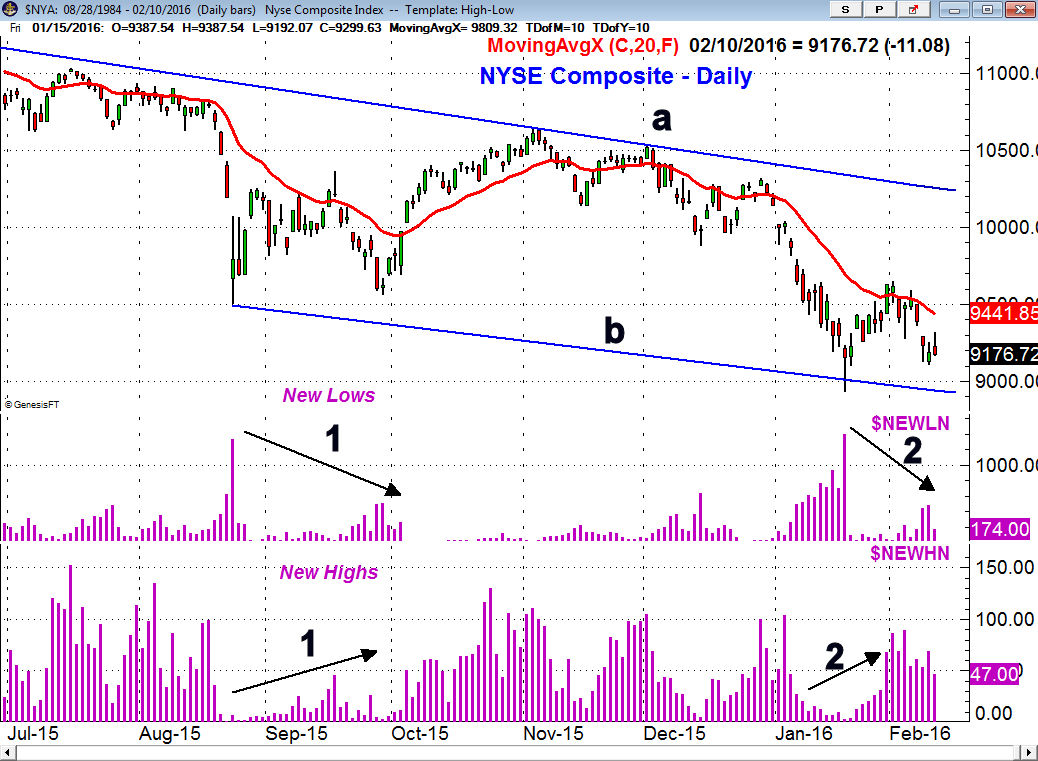
The weakness in the dollar has also gotten much attention but there was evidence at the end of January (Is This The Stock Market’s Secret Weapon?) that it has broken key support, line a. The dollar index had a classic two week rally from the mid-February lows before resuming its downtrend. It will make new correction lows this week with the 38.2% Fibonacci retracement support in the $92.45 area. This is approximately 2.7% below Friday's close.
I continue to expect that the weaker dollar will help boost earnings in the next few quarters as exports from the US will become more attractive. The more cautious tone from the FOMC put additional pressure on the dollar and has given many of the Asian currencies quite a boost. The Singapore dollar and other currencies in the region hit multi-month highs.
The Economy
The stock market paid little attention to the economic data this week as it put more emphasis on the FOMC announcement. The February Retail Sales came in at +0.3% but the downward revisions of January's numbers still does not paint a rosy picture of consumer spending.
Producer Prices were also soft but for a change the Empire State Manufacturing Survey was positive after six months of weakness though inventories were weak again last month. The Housing Market Index was unchanged as apparently as builders are limited by available lots and qualified labor. The Housing Starts Wednesday did not help as permits were down 1.3%.
The Industrial Production was lower overall than the consensus estimate but there some positive components and Thursday's Philadelphia Business Survey came in at 12.4 up nicely from -2.8 the prior month.
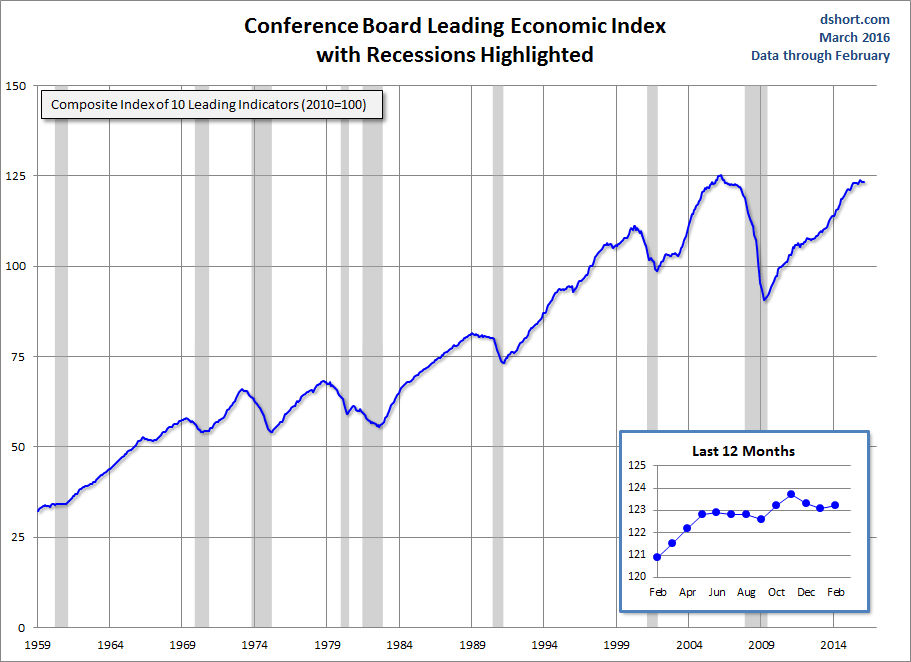
My favorite economic indicator, the Leading Economic Index (LEI) increased by 0.1% in February after declining the previous two months. It has a good record of peaking before a recession as it peaked 15 months before the 2008. Clearly it is not rising as strongly as it was in 2015 but the Conference Board commented that " its six month growth rate remains consistent with a modest economic expansion.".
The mid-month reading on Consumer Sentiment came in at 90 which was the lowest reading in the past six months but if stocks remain strong it could improve by the end of the month.
The Chicago Fed National Activity Index is out on Monday along with Existing Home Sales and it is followed Tuesday by the flash reading on PMI Manufacturing Index as well as the Richmond Fed Manufacturing Index. New Home Sales come out on Wednesday with Durable Goods on Thursday. On Friday the markets are closed and we get the final reading on 4th quarter GDP.
Interest Rates & Commodities
The yield on the 10 Year T-Note dropped last week to 1.871% after yields came close to 2.00% the prior week. The downtrend is still intact but the weekly studies do not currently favor a break below the major support in the 1.691% area.
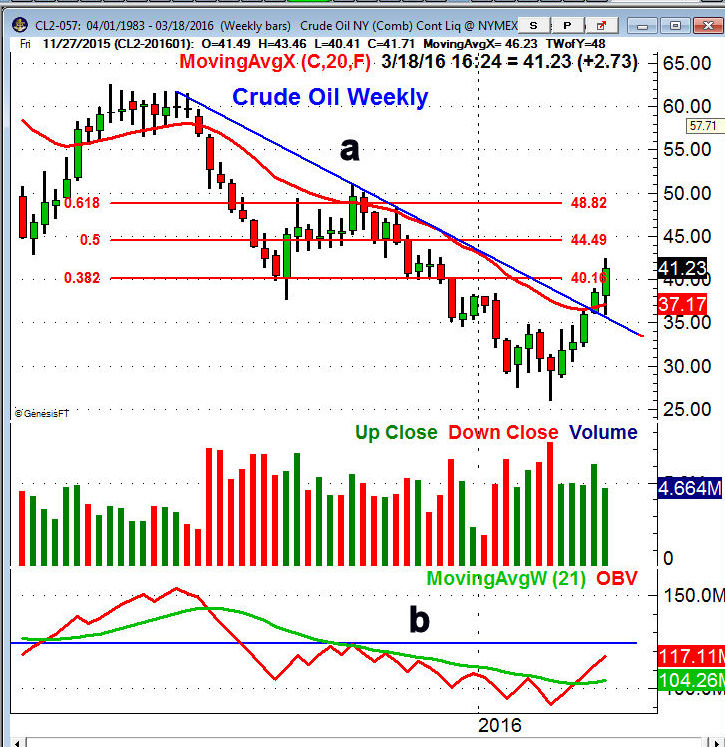
Crude oil was down on Friday but had another good week as the near term 38.2% Fibonacci resistance at $40.16 was overcome. The downtrend (line a) was broken two weeks ago. The 50% resistance level stands at $44.49.
The weekly on-balance-volume (OBV) moved above its WMA three weeks ago but did not form any positive divergences at the lows. It is still below the major resistance at line b. The weak volume unfortunately kept me on the sidelines as I was looking for a pullback to buy. There is initial support at $38.50 with the 20 day EMA at $36.55. I continue to expect a sharp pullback in crude oil over the next few weeks.
Market Wrap
The Dow market averages led the market higher last week with the Dow Transports up just under 5% followed by a 2.3% gain in the Dow Industrials and a 1.8% rise in the Dow Utilities. These more narrowly based averages did much better than the S&P 500 which was up just 1.3%. The S&P's gain was matched by the small cap Russell 2000. In last week's column A Bear Market Rally or More? I again outlined the reasons why I thought this was more than a bear market rally.
It was another week of strong market internals were strong as there were 2271 advancing stocks on the NYSE while 907 stocks declined . The ability of the NYSE A/D line to move above its WMA on February 26th was a very bullish signal that most did not recognize. There are still many who are fighting the rally as one media analysts commented that he would not give up his short positions until the S&P 500 closed above 2070. This would be a move of 14.3% from the lows which is a long ways to fight a losing trend.
In my February 23rd article " Don't Follow Those Bearish Traders" I urged both investors and traders not to guide their investments or trades based on the views of the media analysts who were uniformly bearish at the time. I was my hope that my readers would see the wisdom of doing their own analysis and concentrate on the technical tools that I use in my articles and teaching sessions.
Most regular investors are still much more positive than they were a month ago even though the latest survey from AAII showed a surprising 7.4% drop in the bullish % to 30% while the neutral% rose to 43.2%. The VIX or so called "fear index" has continued to decline as it dropped below 15 on Wednesday. This low level of fear and the declining put/call ratios are signs of a market that may be getting complacent.
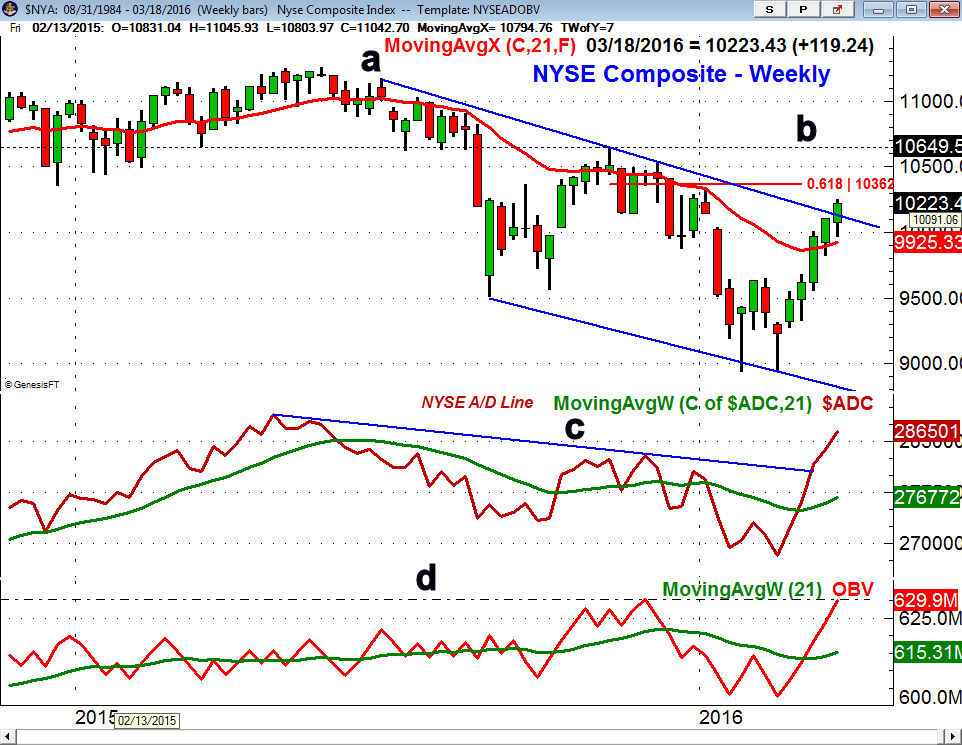
The weekly downtrend in the NYSE Composite (line a) was decisively overcome last week as it is now close to the 61.8% Fibonacci retracement resistance at 10,362. There is even stronger resistance in the 10,649 area , line b. There is weekly support now in the 9800-9925 area and the 20 week EMA.
The sharp rally in the A/D line and the move above its downtrend (line c) and the December 2015 highs is a sign of strength. The A/D line is now quite a ways above its rising WMA which makes a pullback more likely. It was also a good sign that the lagging OBV is now very close to making a new all time high, line d.
The sharply rising A/D line is the best environment for stock pickers as while the % of stocsk above their 50 day MA has increased there are still stocks that are now just completing bottom formations. Profits in INTC and ROST were taken by Viper Hot Stock clients and these stocks ADSK, AKAM, INTU, DY, EEFT, USCR, VRSK,LMCA, NFLX and YHOO all gave new buy signals after Wednesday's close. They all rallied sharply late in the week.
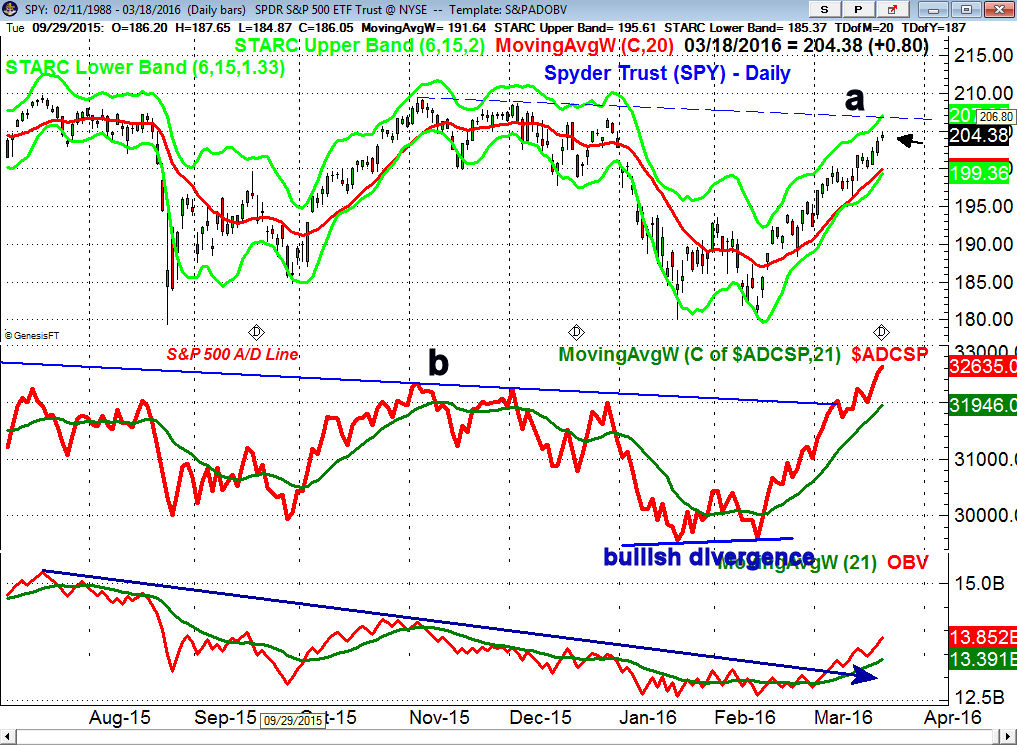
The Spyder Trust (SPY) added further gains last week but is still below the major chart resistance and the daily starc+ band in the $206.60-$207 area. The SPY formed a doji on Friday, which is a sign of indecision and a daily close below $203.80 will generate a short term sell signal. There is first good support now in the $200 area with the 20 day EMA at $199.27. This is 2.5% below Friday's close and there is much stronger support in the $194-$196 area.
The S&P 500 A/D line first surpassed its downtrend, line b, on March 7th and has accelerated above it over the past two weeks. This resistance goes back to the all time high in the A/D line from May 2015 which has not yet been overcome.
What to do?
The fact that the S&P 500 has reached the 2050 level has clearly changed the outlook of many Wall Street professionals. Some are now feeling they have to be buying and some are starting to worry about their quarterly performance.
The extent of the rally and the divergences in some short term indicators like the McClellan oscillator makes me believe a correction is becoming more likely in the next few weeks. Therefore Viper ETF clients have been scaling out of longs in XLB and XLU while traders took profits in DIA. There are a number of ETFs that look positive based on the weekly analysis but they need a pullback to generate an entry point.
For the past few weeks I have also suggested that those investors who wanted to reduce their stock holdings after the January drop should adjust their holdings on strength. On the other hand those who want to become more fully invested should view a 1 or 2 week decline as a buying opportunity.
Editor's Note: If you like Tom's analysis he will be teaching a three hour interactive course "The Secrets of Volume" to a very small group of clients in April. If you are interested in learning about volume send an email to Volume Analysis at wentworthresearch@gmail.com and you will be sent more information.
Comments
comments