The bumpy ride for the stock market has continued in February as the upside reversal on Wednesday failed to stimulate much new buying. Still it was supportive that the major averages were able to recover substantially from the Wednesday lows as after Tuesday's drop the bearish sentiment had spiked as there was heavy put buying Tuesday.
Individual investors also became less positive last week as the bullish% dropped 2.2% to 27.5% and could drop further this week though doubt it will go below the low of 17.9% on January 14th. The bearish% dropped 5.2% to 37.3% as the neutral camp rose 7.5%.
The S&P 500 had dropped down to the 1872 level in early trading Wednesday but then was able to close 40 points higher at 1912. Now the focus is on Wednesday's early lows as a drop below these levels would be a strong sign that the rebound from the late January lows was over. These lows were tested Friday but the market managed to close above the lows.
The weaker than expected jobs report did not help as the stock market opened a bit lower on Friday and the selling picked up as the day progressed. The number of new jobs was about 30,000 less than economists expected though the unemployment rate did drop to 4.9%. The three month average gain of 231, 000 jobs is still moderately healthy.
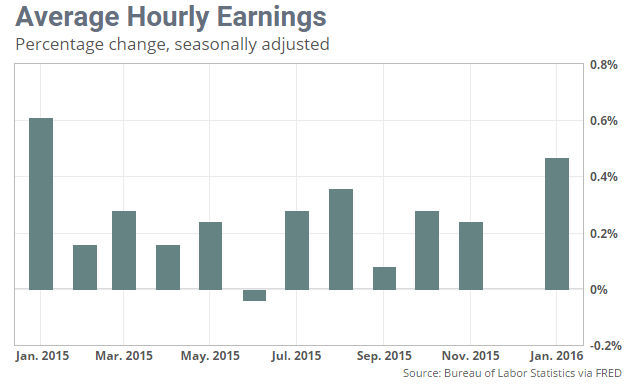
The 0.5% increase in hourly wages was the largest in a year and does suggest a healthy job market. This along with recent report of another quarterly 0.6% increase in the employment cost index is a sign that higher inflation is now more likely. Investors should realize that an upward trend in inflation is much better that the threat of deflation.
Stocks have been edging higher as some investors now feel that the signs of a weaker economy makes multiple rate hikes less likely. This is of course a double edged sword as the economic weakness is a reason for other investors not to buy stocks as it may mean that earnings will continue to weaken. This was the dominant sentiment at the end of the week.
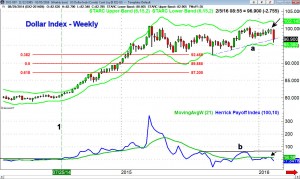
The dollar looks ready to drop over 2% this week and the weekly chart shows that it will close below the prior week's doji low. This sell signal is consistent with a further decline though it looks as though the weekly support ( line a) will hold this week. The weekly starc- band is at $95.04 or about 2% below Friday's close. The 38.2% Fibonacci retracement support is at $92.45 which is just below the August 2015 low of $92.52.
The dollar index had completed a significant bottom in July 2014 as the Herrick Payoff Index (HPI) moved strongly into positive territory and prices overcame major resistance. The HPI had also helped to identify the recent low in crude oil.
The HPI failed to move above the prior highs, line b, on the recent rally. This bearish divergence was a sign of weakness and the HPI has now dropped below the zero line after failing to move above its WMA. This means that the money flow is now negative.
The daily analysis is also negative on the dollar index but it is testing the starc- band which makes a bounce likely over the short term. I will be looking for a new entry for Viper ETF clients in the PowerShares DB US Dollar Bearish ETF (UDN). The volume in UDN is relatively thin but it looks like the best way to trade a lower dollar.
So why could a lower dollar help the Fed and the economy?
The most obvious reasons as that it will make our exports more attractive and help revive the weak manufacturing sector. A weaker dollar would also help the earnings of the large multi-national companies whose earnings have been significantly weakened as the dollar index has appreciated 20% since the July 2014 lows.
Weakness in the dollar will also help the emerging markets satisfy their debt burden which is generally denominated in dollars. Even if the Fed does not continue to raise rates they are still higher in the U.S. than in most developed countries as Japan moved to negative rates last week. A weaker dollar should be supportive for crude oil and materials which are denominated in dollars. This could also help the beaten down mining and commodity stocks finally stop declining.
Clearly the thought of higher rates in the US this year has caused some capital flows into the US dollar and so we are likely to see some outflows if the dollar moves lower. Other possible negatives from a weaker dollar are consumer related as they will need to spend more to buy imports and other goods.
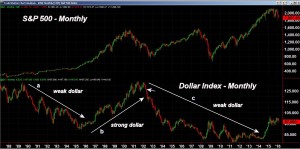
The impact of the dollar on the US stock market is not clear from the long term charts. The dollar completed a major technical top in 1985. As I commented in a 2011 article "In May 1985, my analysis of the OBV on the major currencies was instrumental in helping me identify major bottoms in currencies like the Deutsche mark (DMK) and Swiss franc (CHF), and therefore, the top in the US dollar (USD). At the time, most of the leading economists were expecting the dollar to remain strong for a few years. The dollar had bottomed in November 1980 with the election of Ronald Reagan."
The dollar stayed weak for ten years, line a, finally bottoming in 1995. Stocks accelerated to the upside as the dollar began a six year rally. The Nasdaq Composite completed its top in March 2000 but the S&P 500 did not top out until the fall. The dollar continued higher until April 2002 when it completed a classic top formation.
The dollar continued lower even though the stock market bottomed out in 2003 and began its run to the October 2007 high. After making a low in late 2004 the dollar rallied in 2005 before resuming its downtrend.
The dollar rallied sharply in the second half of 2008 but by the end of 2009 it was again back to the lows. After a three year trading range, the dollar finally bottomed out in 2014 and it has since moved higher along with the stock market.
Given the current market environment I think that the positive factors from a weaker dollar outweigh the negatives so a lower dollar should be supportive for stock prices.
The Economy
The economic data last week validated the view of a weaker economy as the ISM Manufacturing Index came in at 48.2. This was as expected as it was below the 50 level which is consistent with an economic contraction.
The PMI Manufacturing Index came in at 52.4 as it was helped by a firming in new orders. This may be a sign of improvement for manufacturing but that will take a few months to confirm. The market was nervous about the ISM - Non-manufacturing Index and the PMI Services Index so the weak numbers Wednesday sparked renewed selling in the stock market.
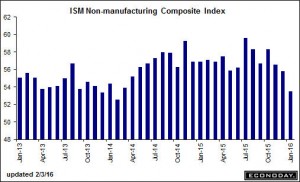
The ISM came in at 53.5, lower than the expected 55.5 but still well above the 50 level. The chart shows that it has been in a continued slide since last summer when it was near 60. New orders remain solid at 56.5 but down from 58.9 in December. The PMI Services Index came in at 53.2 which was down from 54.3 and these readings do signal softening in the 1st quarter.
Factory Orders dropped 2.9% which was a sharp decline from the downwardly revised 0.7% decline in November. Looking inside the report there were few positives with orders for capital goods down 4.3%, and shipments off 1.4%. The weak exports are a big factor as the strong dollar has not helped.
The weak calendar this week may be a plus as most of the data comes out on Friday with Retail Sales, Import and Export Prices, Business Inventories and Consumer Sentiment. Of these numbers the focus is likely to be on sales as well as on the all important consumer sentiment.
Interest Rates & Commodities
Yields dropped sharply in early January and the subsequent break of yield support in the 2.00% area projected much lower yields. The close at 1.848% on Friday was below the April 2015 low which projects a further decline to the 1.740-1.760% area. In February 2015 yields briefly hit 1.654% but just four days later they had risen to 1.938%. I would expect the current decline in rates to end with another spike low in rates.
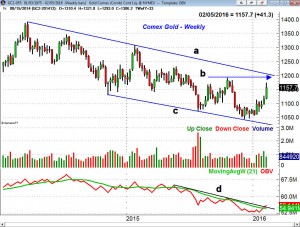
The Comex Gold futures closed up over $41 last week as the lower dollar definitely gave the metals a boost. The weekly chart shows converging resistance, lines a and b, in the $1200 area. There is additional resistance in the $1220-$1230 area.
The low volume at the end of the year suggested the gold market could be sold out. Though the volume has picked up on the rally the weekly OBV has just barely moved above its downtrend, line d. I will be looking to evaluate a pullback in the next week or two.
Crude oil closed the week lower ye there are still signs that the short covering rally is not over yet. To support this view crude needs to close higher this week.
Market Wrap
The weaker than expected jobs report scared away the few buyers as the recessionary fears mounted as the day progressed. Weaker than expected earnings took LinkeDIn Corp. (LNKD) down a whopping 43.6% on the day. Another high flyers Tableau (DATA) was down 50% as its guidance disappointed. many other high flyers like Amazon (AMZN) and Neflix (NFLZ) are down 25% or more YTD. There were several good stock trading opportunities as Viper Hot Stock traders closed out longs in STZ and short positions in AHS
The 3.1% drop in the S&P 500 last week did not look to bad when compared to the 5.4% drop in the Nasdaq Composite. The small caps did not do much better as the Russell 2000 lost 4.8% while the Dow Transports gained 0.52%. The 2.5% drop in the NYSE Composite was worse than the 2 to 1 negative A/D ratios.
The basic material stock bucked the trend last week as they were up 4.3% followed by a 2.4% gain in the utility stocks. Technology and consumer services stocks were down 5.6% and 5% respectively while oil & gas, health care, financials and consumer goods were all down more than 3%.
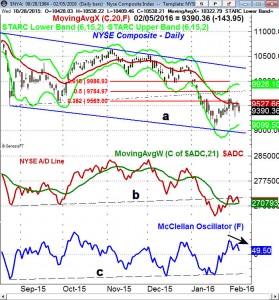
The NYSE Composite tried to move back above the 20 day EMA (9527) on Thursday before dropping 1.5% on Friday. The rally from the January lows did slightly exceed the 38.2% retracement resistance before the NYSE turned lower. The stronger resistance at 9784 has not been reached.
On a drop below last Wednesday's low at 9276, the daily starc- band is at 9099 with the January low at 8937. The lower boundary of the trading channel is in the 8850-8890 area. The NYSE A/D line appears to have stalled at former support, now resistance at line b. The McClellan oscillator looks as though it has completed a short term top but is likely to form a further positive divergence if the NYSE makes a new daily closing low.
Despite the sharp drop Friday the Spyder Trust (SPY) is still holding above the nine day lows at $187.06 as Friday's low was $187.20. Many traders are expecting heavy selling on Monday's opening with the daily starc- band at $185.83 and the January low was $181.02. The SPY now needs a close back above $192.75 to resurrect the uptrend.
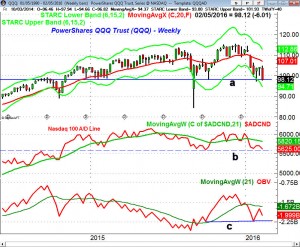
The PowerShares QQQ Trust (QQQ) closed on weekly support, line a, last week but just above monthly pivot support at $97.53. The weekly starc- band was violated three weeks ago and it is now at $94.73. There is short term resistance now at $101.60 to $103.17 and the declining 20 day EMA.
The weekly Nasdaq 100 A/D line turned lower last week but is still slightly above the prior lows. There is still major support at line b. The A/D line needs to move above the recent high to suggest a new uptrend could be starting. The weekly OBV turned down before reaching its WMA but is still above the strong support at line c.
What To Do? Investors who were nervous about their equity exposure had an opportunity to reduce their position last week though the market did not reach the stronger resistance levels I had identified in last week's column.
Most are expecting an ugly start this week after the relentless selling on Friday. However the very high put/call ratios and the two upside reversals do allow for bargain hunting to come it at lower levels. Newcomers to the short side of the market are likely to have less staying power and a move above last week's highs should make them nervous Such a move is needed to indicate that the oversold rally from the January lows is not yet over.
For investors there are no strong signs yet of an intermediate term market bottom so it may be a tough few weeks. I do expect the SPY to be 5-10% above current levels before the end of the first quarter so long term investors should not give up as equities are still the best bet and a lower dollar may be the catalyst.
There are still some opportunities in special situation ETFs as Viper ETF subscribers took very nice profits on the long term bull call spread position in the Market Vectors Gold Miners (GDX) last week. There are some also some encouraging signs in the emerging market ETFs where new longs were established near the lows. as well as the resource based ETFs.
I will be traveling next week so the next Week Ahead column will be published on February 19th. of course you can follow me on Twitter for interim updates.



2 thoughts on “The Week Ahead: Is This The Stock Market’s Secret Weapon?”
Comments are closed.