

The very volatile 1st quarter ended on Thursday and the results confounded the majority of fundamental and technical analysts. Those that were right about the strong performance of gold were likely way off the mark as to where markets closed the quarter.
There were not many advisors who started the year being bullish on emerging markets but also negative on Europe. According to a WSJ article " As 2016 started, a popular view was that equities, particularly in Europe and Japan, were in favor, government bonds offered little value, and emerging markets were still too risky and troubled."
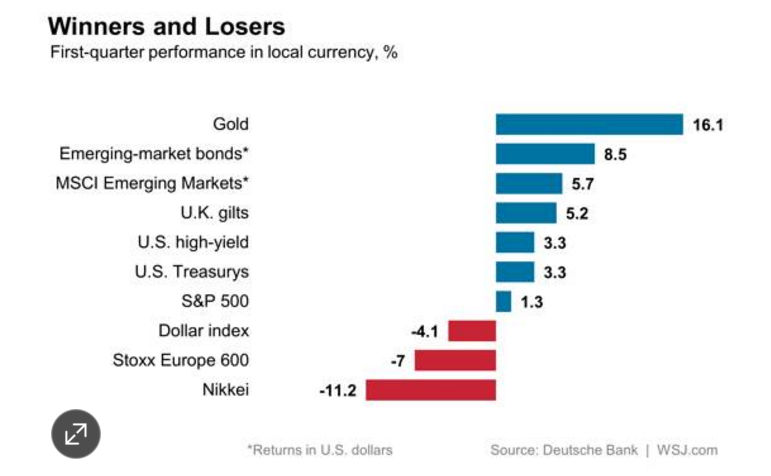
The emerging bonds and markets did well up 8.5% and 5.7% respectively while Japans Nikkei was down 11.2% as it was the worst major performer. Both US Treasuries and high yield bonds surprised many as the collapse of junk bonds in December and closing of the Third Avenue Focused Credit Fund had many worried that it was just the start of a waterfall decline in junk bonds.
With the next earnings seasons unofficial start on April 11th when Alcoa Inc. (AA) reports. Many investors are already getting nervous. As has been the case for most of the past year the pre-quarter earnings estimates have been continuously lowered even before the earnings season has started.
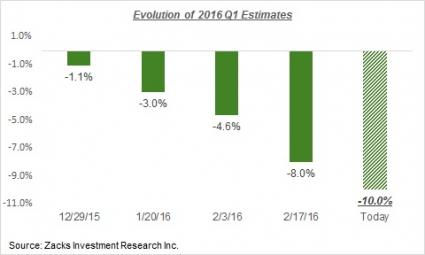
This chart from Zacks shows the evolving trend of 1st quarter earnings estimates starting with the December 29th estimate at -1.1%. By early February analysts were calling for a 4.6% decline and as of last week it has become even more negative at -10%. If the analysts are correct then this would be the third straight quarter that profits have declined on a year over year basis.
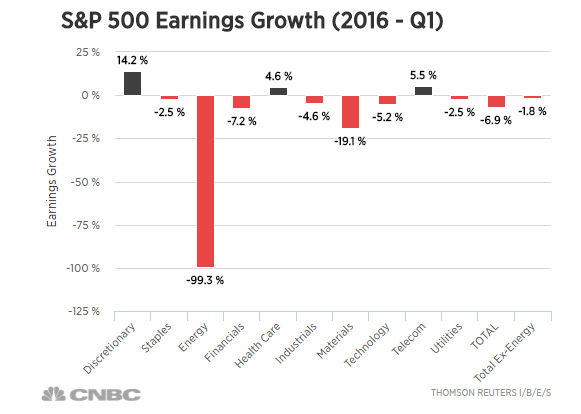
A good part of the pessimism is tied to the belief that oil and gas company profits are expected to fall by 99%. If the energy sector is excluded then the rest of the S&P 500 is expected to see a earnings decline of 1.8%. A decline in earnings of 5% is expected by the technology and financial sectors which are two of the largest components of the S&P 500. The only real bright spot is the consumer discretionary sector where Thomson Reuters is looking for 1.14% increase.
Of course I prefer to determine sector investments based on their technical outlook. The Consumer Staples Sector Select (XLP) and Utilities Sector Select (XLU) were two of the best performers in the 1st quarter up 5.6% and 15.5% respectively. The bullish readings from the monthly technical studies made them two of the favorites of the Viper ETF Report.
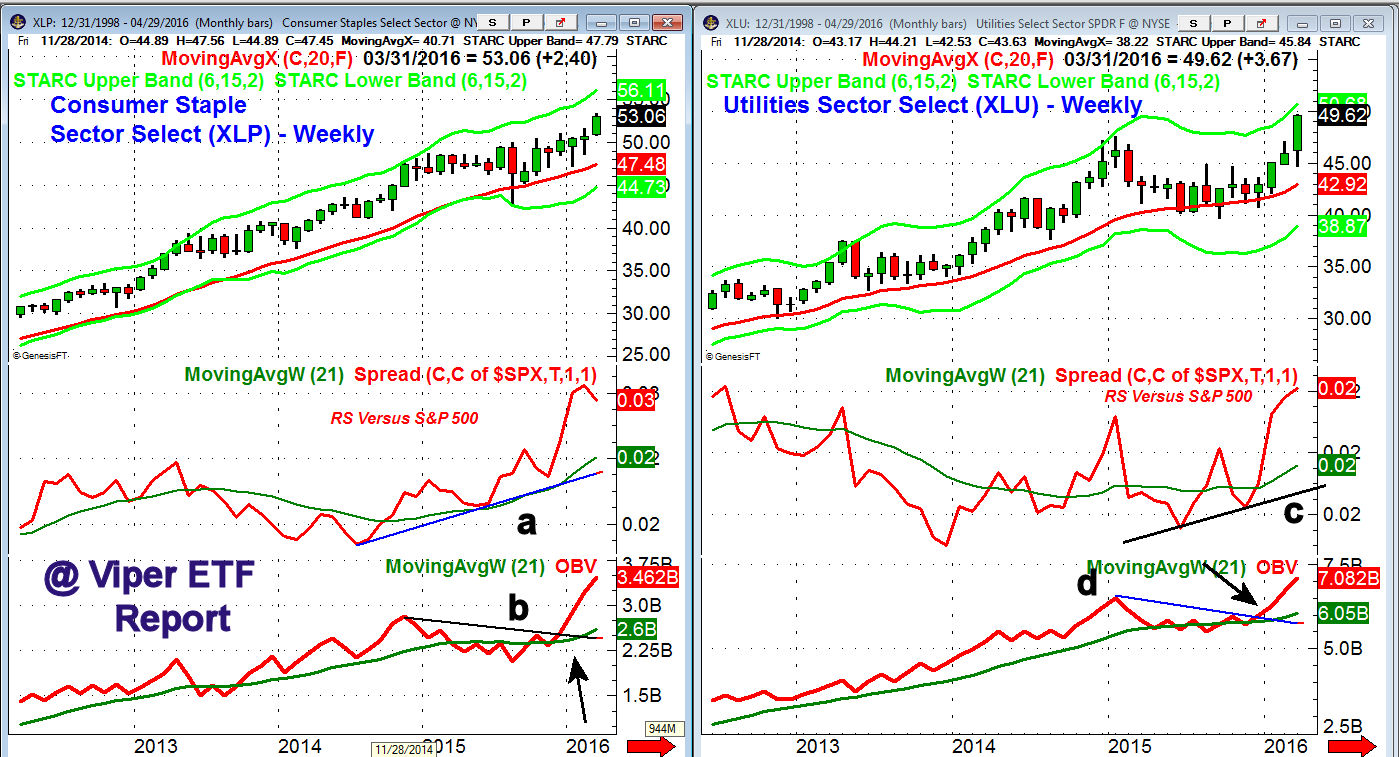
The monthly relative performance on the Consumer Staples Sector Select (XLP) shows a strong uptrend (line a) since 2014 as it made a significant new high in early 2016. The OBV broke through resistance, line b. in December and has been acting stronger than prices.
The monthly relative performance line was acting much stronger than prices, line c, at the end of 2015 and has since moved above the 2015 high. The monthly OBV also was strong as at the end of 2016 as it had broken out of its trading range, line d.
Both XLP and XLU are still acting strong though XLU is now approaching my longer term targets. There are several other sector ETFS that are now looking bullish for the 2nd quarter and I will be looking for new good risk/reward entry points.
Of course the 4.1% drop in the dollar index played a large role in the quarterly performance and the technical outlook as of February 6th indicated it had topped out. As I mentioned in the article there are a number a positive effects from a weaker dollar and it is my view that earnings, especially of the energy and large multinational companies, will be better than most are expecting.
Many investors are understandably not ready to invest in the stock market after January's plunge and higher profits are needed to convince them that stocks are a worthwhile investment. If we get positive surprises on the earnings front then it would be just what the stock market needs to propel it even higher.
The 4.8% rise in the Euro versus the dollar has likely helped dampen the rally in the Euro zone markets which do not appear yet to have completed their corrections. A further pullback in the Dax and the other Euro markets may coincide with some consolidation in the US averages.
The Economy
In addition to the strong jobs report last week there was more encouraging data on the economy for a change. A sharp surge in Pending Home Sales in the mid-west contributed to a 3.5% gain for February . The beaten down Dallas Fed Manufacturing Survey improved to -13.6 from a very weak -21.8 and production was actually positive in February.
The S&P Case-Shiller HPI rose 0.8% and Consumer Confidence was a solid 95.2 a bit better than the consensus estimate of 94. On Thursday the Chicago PMI jumped 6 points to 53.6 up from a weak reading of 47.6 the prior month.
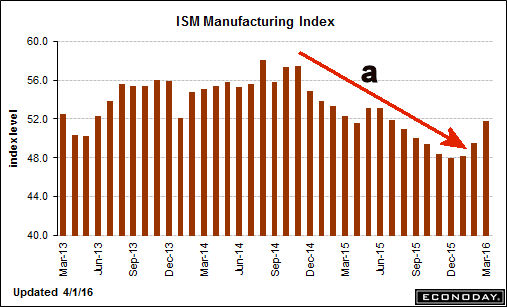
On Friday the PMI Manufacturing Index was pretty much unchanged at 51.5 but the ISM Manufacturing Index came in at 51.8 as it was boosted by a surge in new orders. The chart shows that it had been in a solid downtrend since September 2014 and the downtrend (line a) has now clearly been broken. The better than expected ISM report helped the stock market reverse Friday from the early lows.
This week we have Factory Orders on Monday followed by the PMI Services Index and ISM Non-Manufacturing Index on Tuesday. On Wednesday we get the most recent FOMC minutes which is likely to be fully dissected by the always vigilant Fed watchers.
Interest Rates & Commodities
It was quite a week for the bond market as the volume on Thursday, the last day of the month and quarter was the highest since 2005. Clearly the bond market has been reassured by the improvement of investor sentiment. The yield on the 10 Year T-Note declined last week to 1.792%. It now looks ready to challenge the year's weekly closing low at 1.748%.
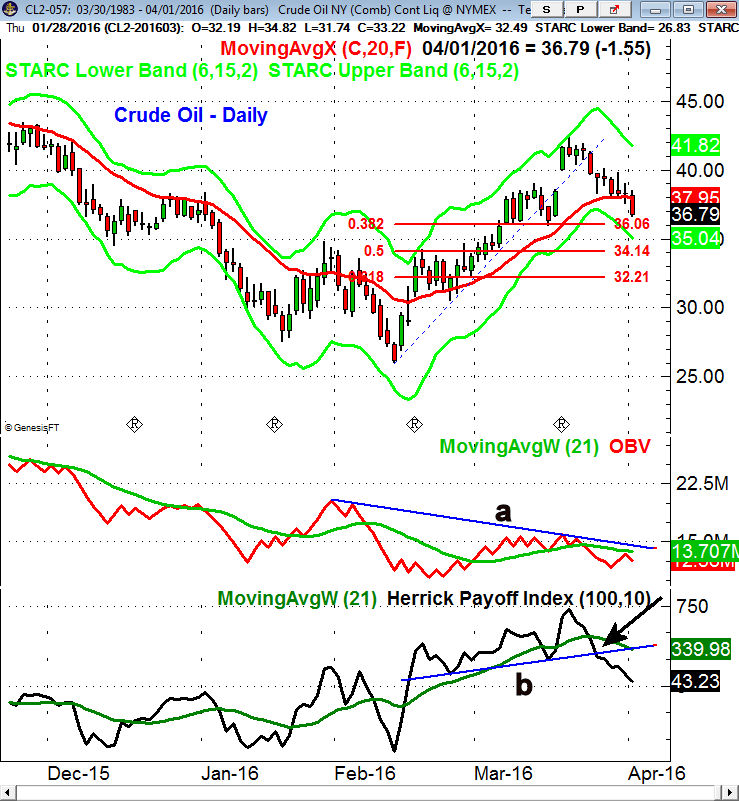
Crude oil was hit hard on Friday as the bearish comments on production from a Saudi minister did not help. There have been signs over the past few weeks that the short squeeze in crude was ending. The volume on the rally had not been impressive as the on-balance-volume (OBV) has formed lower highs, line a, and dropped below its WMA over a week ago. The weekly OBV (not shown) is positive and suggests that a further corrections will be a buying opportunity
The daily Herrick Payoff Index (HPI) has broken its support , line b, and looks ready to drop below the zero line. Prices are now close to the 38.2% Fibonacci retracement support at $36.06 with the more important 50% support at $34.14. The current decline should present a good risk/reward buying opportunity. The monthly and weekly pivot point analysis targets the $34.85-$35.57 area.
Gold also dropped on Friday but settled above the day's lows. The daily and weekly technical studies are both acting weaker than prices as I noted in the March 23rd article "Using Inverse ETFs For Timing & Trend Confirmation". This suggests that we are likely to see a more serious decline in the precious metals that will reduce the too high bullish sentiment. Viper ETF traders are currently long a inverse gold ETF.
Market Wrap
After pausing last week the stock market roared ahead last week with the Dow Industrials gaining 1.6% for the week and the S&P 500 was a bit better as it was up 1.8%. The small caps were strong as the Russell 2000 was up an impressive 3.5%. Even more importantly the weekly A/D numbers were almost 3 to 1 positive. The previously red hot Dow Transports closed 0.5% lower which could be part of a sector rotation.
Clearly the concerns for stock investors have become lower as comments last week from Janet Yellen has convinced investors that any rate increases would be gradual. This combined with the improvement in the economic data and strong job numbers has improved the argument for investing in stocks. At the end of February I tried to urge investors not to worry about the "The Wall of Worry"?.
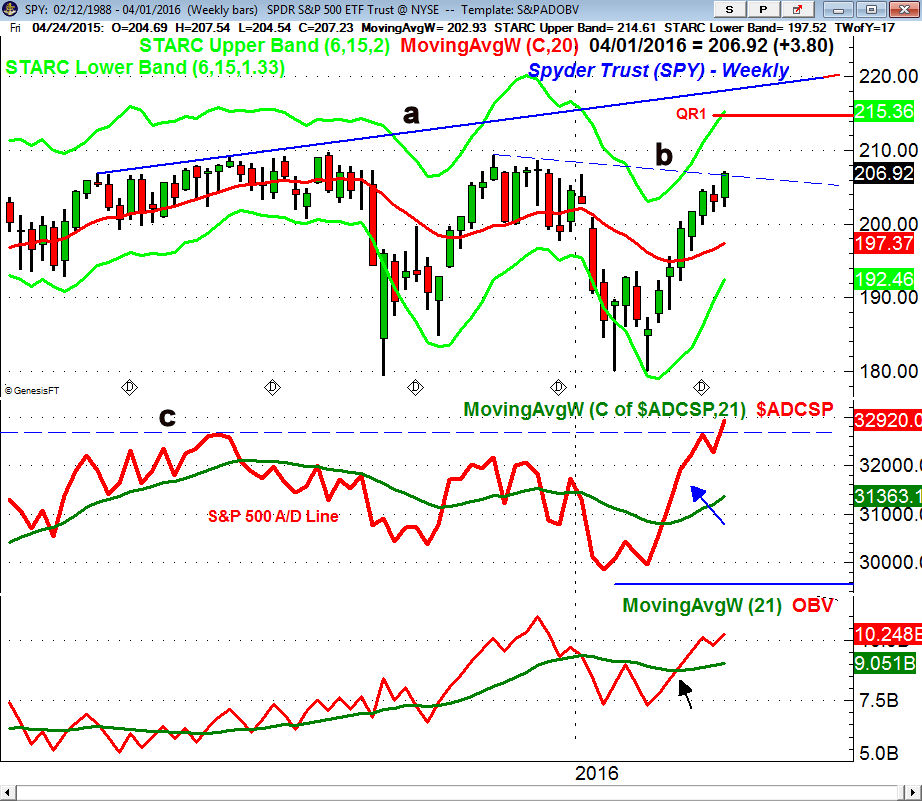
The weekly chart of the Spyder Trust (SPY) shows that it has just barely closed above the downtrend, line b. SPY has started the new quarter well above the 2nd quarter pivot at $197.50 which is a positive trend signal. There is next resistance in the $209.30-70 area with quarterly pivot at $214.90 just below the weekly starc+ band at $215.36.
The most important development is the new all time high in the weekly S&P 500 Advance/Decline line as it overcame the May 2015 highs, line c. The A/D line also shows a bullish zig-zag formation which is typically very bullish. The weekly OBV is also in a solid uptrend but has not yet made new highs.
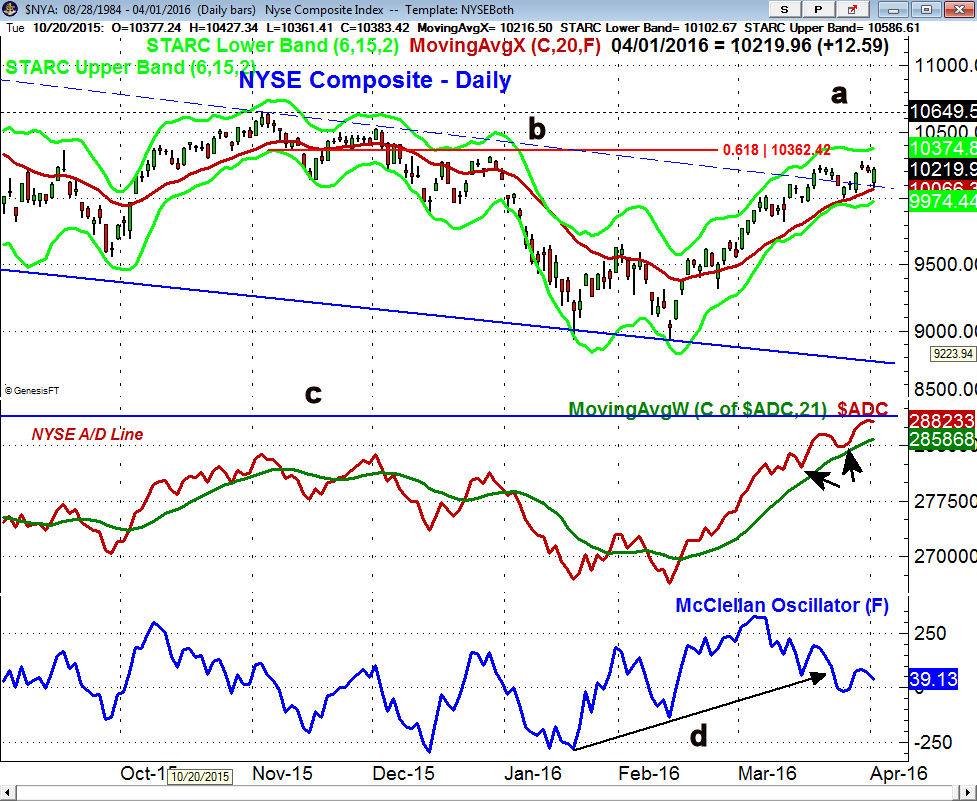
The broadly based NYSE Composite does not look as strong technically as it is still just barely above its downtrend, line b. It is also still below the 61.8% resistance though the S&P 500 is well above its corresponding resistance level. There is even further resistance at 10,650 and it is 10% below the 2015 high of 11,255. The 20 week EMA is at 9957 with the quarterly pivot is at 9808.
The weekly A/D line (not shown) shows a similar bullish pattern as the S&P 500 but is still below the 2015 highs (line c) on the chart of the daily A/D line. It is still in a clear uptrend but a drop in the A/D line below the last two lows (see arrows) would be the first sign of a correction.
The McClellan oscillator broke its uptrend, line d, just over a week ago. The Oscillator is still in a well established downtrend but that could change next week. On a continued rally over the next few weeks a more pronounced negative divergence could form.
The Nasdaq 100 A/D line is rising more sharply now but is still slightly below the 2015 high. The Powershares QQQ Trust (QQQ) is well above its quarterly pivot at $104.99 with the R1 resistance for the 2nd quarter now at $115.41. There are many stocks in the Nasdaq 100 that gave new buy signals last week we are making several new buy recommendations each week in the Viper Hot Stocks Report.
The Russell 2000 A/D line has broken its longer term downtrend but is still well below the late 2015 high. The daily A/D just made marginal new highs last week and has been weaker that the A/D lines of Dow Industrials, the S&P 500 and Nasdaq 100. The 61.8% retracement resistance for the iShares Russell 2000 (IWM) is at $114.66 with the last major swing high at $119.
What to do?
In last week's column "Avoiding A Crisis of Confidence" I discussed that the technical strength had further confirmed my previous view that the sharp decline early in the year was just a bull market correction not the start of a bear market.
I have been cautious for the past few weeks about being an aggressive buyer of the market tracking ETFs. This was based on the necessity of using stops that would mean risk of 8% or more. There are still some sector ETFs that are just turning positive and I am on the verge of taking profits in some hot ETFs like the Material Sector Select (XLB).
Instead of the 1-2 week correction I was expecting we may see more of a trading range as some sectors emerge as new leaders while others like the Dow Transports do have a correction. For investors I am looking for clear signs that some of the large diversified ETFs that focus on Europe or Asian have completed their bottom formation.
For those who sold out during the January slide it is still a good time to review your investment plan.
Comments
comments