The public enthusiasm for the stock market has continued to deteriorate over the past few months. Last weekend, a Barron’s columnist referred to the prior week as “volatile flatness,” as despite wide swings during the week, the Dow ended only 48 points lower. In the article, the head of institutional equity strategy at Stifel predicts “the market declining 5% to around 2520 by the end of September.”
There has been a downward trend in the sentiment of the individual investor since early January. This has been detailed in the weekly American Association of Individual Investor Survey, which tracks the percent of bullish, bearish and neutral investors.
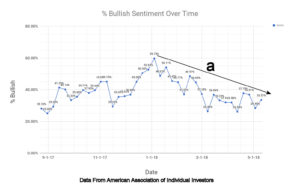
As regular readers of my articles have seen, I apply technical analysis not only to price action, but to a variety of indicators. The chart above, of percent bullish sentiment in individual investors, shows the downtrend (line a) from the early January high at 59.75% bullish. Over the past few weeks, the bullish sentiment has been trying to bottom out in the 30% area, as seen by the challenges to the downtrend and the formation of higher lows. There was a reading of 28.40% on May 3. This level is still well above the very low bullish percent levels typically seen at major market bottoms. That being said, the current market action is not a major market bottom, but rather, a pause in the positive major trend.
In the past month, there has also been a change in the sentiment of the professional analysts and investment newsletter writers. Several strategists have not altered their upside targets, but have been warning of a drop as low as 2350-2400 in the S&P 500 before it rallies back to 2850.
This frustration amongst market professionals may have reached its peak after the close Tuesday as Jim Cramer referred to the current market action as a “stupid market,” characterized by its “sheer incoherence” that was “dumb as a bag of hammers.”
This was not surprising to hear from Cramer, a long time market fundamentalist who expects that the market will respond rationally to current macroeconomic and geopolitical trends as well as individual corporate profit/loss statements.
As a technical analyst, I take a far more cautious approach to predicting market action, and base any predictions on price action, volume, and other indicators, as well as chart formations. These signals often do not agree with the current fundamental data or the prevailing wisdom, but in my experience are a more consistent predictor of market activity.
It has not been a kind bull market for those hedge funds that invest based solely on their macroeconomic outlook. Since early in the bull market, they have expected that expansionary monetary and fiscal policy would necessarily result in faster economic growth and inflation.
The Barclay’s Global Macro Index was up 0.21% in 2017, down 0.60% in 2016 and up 1.79% in 2015. As many are aware, the Spyder Trust (SPY) was up 21.7% in 2017, 12% in 2016 and 1.25% in 2015. Many financial writers who were concerned that a collapse in the Chinese economy would have a domino effect on the global markets have stayed out of stocks for much of the bull market. Fears over China's continued growth have been a mainstay in what's known as the “Wall of Worry” that keeps investors out of the stock market.
Of course, the continued skepticism over the health of the stock market is consistent with the continuation patterns that have developed in most of the key market averages. This was discussed in my late April article, “The Good And Bad News For Investors.” These patterns typically last long enough to frustrate previously bullish investors into becoming neutral, or even bearish on the stock market.
As I pointed out, the bad news then was the fact that the continuation patterns had not been completed, while the good news was that an upside resolution and a resumption of the bull market was the likeliest outcome.
Although I have not been expecting or predicting a downside break of the trading range over the past few weeks, I had been unable to rule it out. However, on May 3, an intra-day break of the 200-day MA was followed immediately by a bullish reversal, and by a strong rally the following day providing some strong evidence for a bullish conclusion to this continuation pattern (“Should You Be Getting Ready To Buy?”).
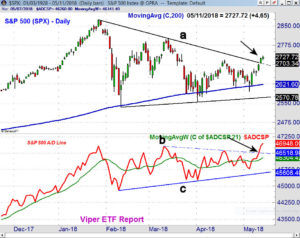
The action last week has moved the balance of evidence firmly into the bullish mode. The S&P 500 closed the week above the downtrend (line a), although some are waiting for a move above the March 13 high at 2801.90 for confirmation that the triangle formation has been completed.
The S&P 500 A/D line has moved well above the resistance (line b) and has clearly moved out of the corrective mode. This is the A/D line signal that I have waiting for since April 21,when I commented that it needs “a strong close above the resistance at line b, to signal that the correction in the S&P 500 is over.” In my view, the ability of the market data on the A/D line to signal a change in the market’s trend is one of the key advantages of technical over fundamental analysis.
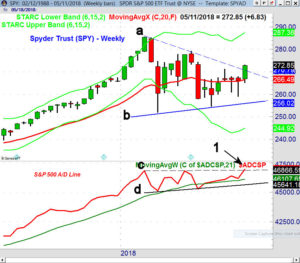
In technical analysis, it is important to look at the key market averages using different time frames. The Spyder Trust (SPY), which tracks the S&P 500, was up 2.6% for the week and also closed above the downtrend (line a). This completed the flag formation (lines a and b). The width of the formation can then be used to calculate upside price targets. The initial targets derived from the mid-point of the formation are in the $285-$287 area. The weekly starc+ band is now at $287.36.
The weekly S&P 500 advance/decline line confirmed the price action, as it closed at a new high, overcoming the A/D line resistance (line c). The completion of the trading range in the A/D line indicates that more stocks are now advancing than are declining, which is a sign that the buyers are starting to take over.
All of the major averages except the Dow utilities were up over 2% for the week, with the Dow Transports leading the way, up 3.3%. The weekly NYSE A/D ratios were better than 2-1 positive, with 2132 stocks advancing versus 953 declining.
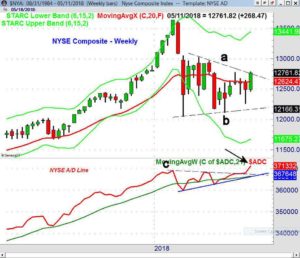
The NYSE Composite is the broadest measure of the stock market, as it includes all 1900 stocks that are traded on the New York Stock Exchange. The chart shows that resistance (line a) was just barely overcome last week. There is still strong resistance in the 13,000 area. The weekly starc+ band is at 13,441.
I have been following and writing about the NYSE Advance/decline line since the 1980’s and I feel it is the most reliable measure of the stock market’s internal health. Therefore, when the daily NYSE A/D line made a new high in the middle of April (see chart) it further supported the bullish case.
The strong surge in the weekly NYSE A/D line last week confirmed the daily breakout in April. Of course, the monthly A/D line has been above its WMA since early in 2016, which was a sign that the stock market’s correction early in the year had not changed the positive major trend.
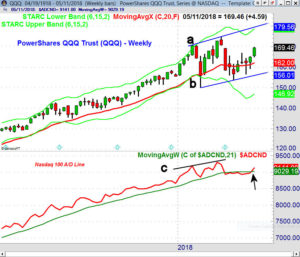
The volatility this year in the PowerShares QQQ Trust (QQQ) has been especially high in 2018, as it dropped 12% following a high in March at $174.93. The chart shows that there have been wide swings over the past few weeks, but the close last week was above the highs of the prior six weeks. The upper boundary of the weekly chart formation (line a), is in the $179-$180 area along with the weekly starc+ band.
The weekly Nasdaq 100 A/D line made a significant new high in March, which was a positive sign for the intermediate term trend (line c). The weekly Nasdaq 100 A/D line, which has been lagging, has finally moved above its WMA this week for the first time in seven weeks. The daily Nasdaq 100 A/D line (not shown) has completed its triangle formation but is well below the March high.
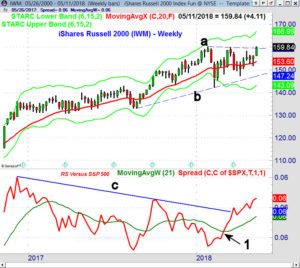
Over the past three months, the small cap iShares Russell 2000 has led the other averages, up 9.2% versus a 4.4% gain the SPY. This outperformance is consistent with the relative performance analysis that indicated in March (Is It Time To Rotate Into Small Cap Stocks?) that IWM was going to lead the SPY.
The relative performance (RS) analysis plays a major role in my selection of ETFs and stocks to buy or sell. It measures the performance of an ETF, like IWM, versus the S&P 500. The first sign that IWM was going to lead SPY occurred in early March (point 1) when the RS moved above its WMA. This was confirmed three weeks later when the RS moved above the downtrend (line c).
The RS improved last week, as IWM closed just above the resistance (line a). The weekly starc+ band is at $166.95, while the chart formation has initial upside targets in the $168-$170 area. The weekly and daily Russell 2000 A/D lines have also broken out to the upside and confirmed the price action.
The positive weekly RS analysis was a reason to buy the Technology Sector Select (XLK), Consumer Discretionary Select (XLY) and SPDR S&P Regional Bank ETF (KRE), even though the market was still in the corrective mode.
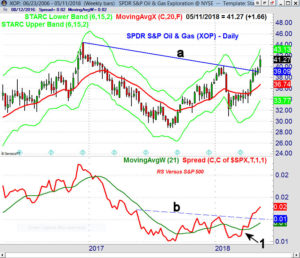
The RS analysis also indicated that the energy ETFs, like The SPDR S&P Oil & Gas Exploration ETF (XOP), were going to lead the market higher. The weekly RS moved above its WMA in early March (point 1) and then completed its bottom in early April as the RS resistance (line b) was overcome. If you would like to learn more about the relative performance analysis you might find this article helpful.
The economic data last week allayed some of the inflation fears, as the Producer Price Index (PPI) and Consumer Price Index (CPI) were both lower than expected. The most encouraging number was the mid-month reading on Consumer Sentiment as it came in at 98.8, almost unchanged from 99 at the end of April.
This week we have Retail Sales, the Empire State Manufacturing Survey, Business Inventories and the Housing market Index on Tuesday. Also out this week are Housing Starts, Industrial Production, the Philadelphia Fed Business Outlook Survey and the all-important Leading Economic Index. Though the market decline was due in part to concerns over the economy, the data shows no signs of a change to the positive trend.
Even though my analysis indicates that the stock market has bottomed, that does not mean that the major averages are all going to quickly make new highs. It is likely to take several weeks before Wall Street and the financial media will stop fighting the rally by turning bullish. It will take time for the positive A/D lines to enter the acceleration mode, which will allow for some good buying opportunities in the weeks ahead.
Be sure that you analyze the risk of any new positions, and be sure to have a firm plan in place before buying. Although they are currently out of favor, I am also closely watching some of the overseas markets.
If you are interested in learning more about the stock market and investing, I hope you will consider the Viper ETF or Viper Hot Stocks reports. Both include specific recommendations twice a week for only $34.95 each per month.


