

Forbes.com: January 14, 2024; The stock and bond markets escaped the latest inflation data last week. The prior week’s slightly better jobs report had taken the averages back to pivot and MA support.
This increased the hopes for a downside break in the averages by the market skeptics. Put buying increased early last week as the S&P 500 “double top fears” from last summer again came to the forefront with headlines like “S&P 4300 by End Of February”. From a technical standpoint, a close below the intervening lows of the double top at 3491 is needed to confirm a double top.
With stocks and bond prices moving higher together some are now worried that they are too closely correlated. According to Bloomberg, SoGen’s data reveals that “Two-thirds of the S&P 500 showing a positive correlation to US bonds.” In their view, this makes further gains in already expensive stocks more difficult.
For most of 2023, the fundamental view that a recession was inevitable was used as a reason why one should not buy stocks. Now it seems that too high valuations combined with the threat of disappointing earnings and the too high bullish sentiment may now be the leading arguments to keep investors and traders on the sidelines.
Others worry whether inflation and yield have really peaked and now seem fixated on guessing how many times the Fed will cut rates this year. This I think is a waste of time as I do not see how it could be an integral part of an investing or trading approach. If you think there will be two rate cuts does that justify 40% in stocks? Do three rate cuts mean 50% in stocks??

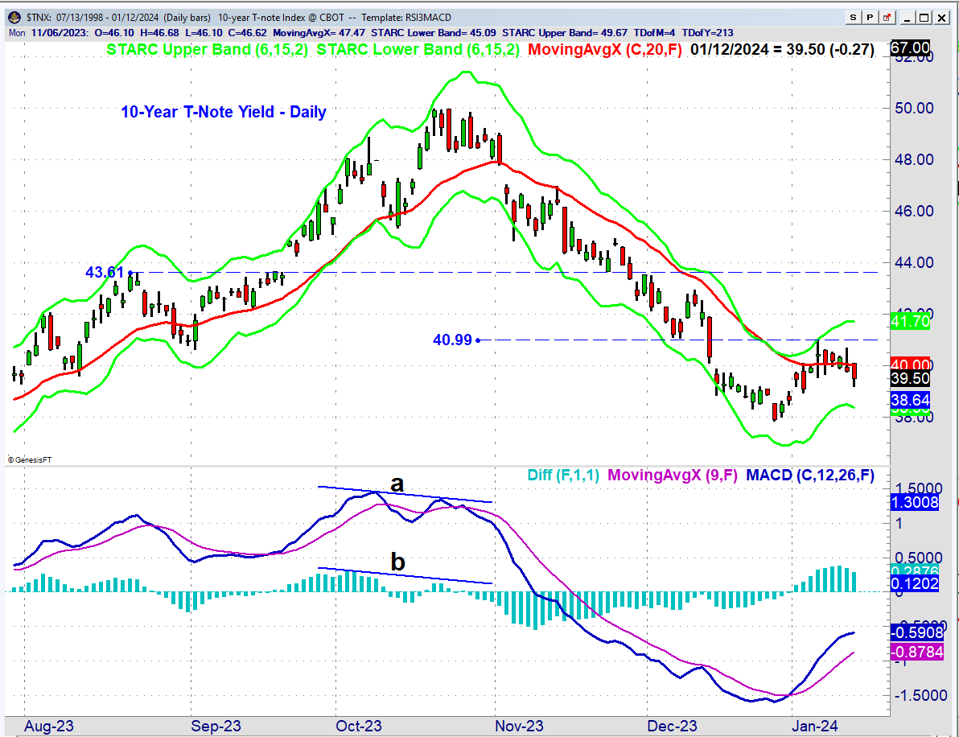
The yield on the 10-year T-Note peaked in October as some bond fund managers gave up on their forecast for lower rates. The lower highs in the MACD lines and MACD-His indicated a loss of upward momentum and likely a top in yields. By early November the 20-day EMA (in red) was declining consistent with this trend.
The most recent low in yields at 3.875% came on December 28th and so far the rebound high has been 4.099%. A move back above this level will be the first sign of a change in trend as the daily yields would then show a pattern of higher lows and higher highs in yield. Weekly yields were lower last week and are still in a downtrend that would take even higher yields to change.

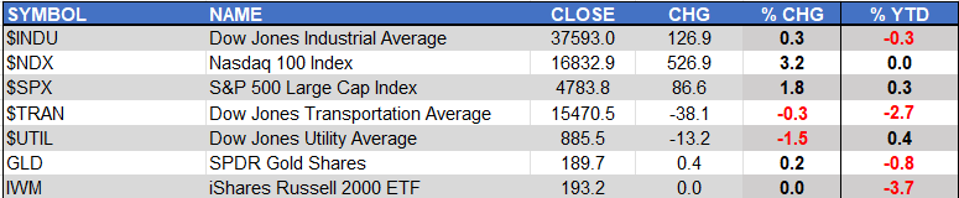
The markets were mixed last week led on the upside by a 3.2% gain in the Nasdaq 100 and a gain of 1.8% in the S&P 500. The Dow Jones Industrials were down 0.3% as they had been leading for the past few weeks.
The Dow Jones Utility Average and Dow Jones Transportation Average were down 1.5% and 0.3% respectively. The Transports are down 2.7% year-to-date YTD but the iShares Russell 2000 is down 3.7%.
Those of my students who closely follow the A/D numbers observed a slightly upward bias during the week but were not convincing. On the NYSE there were 1578 issues advancing and 1351 declining.

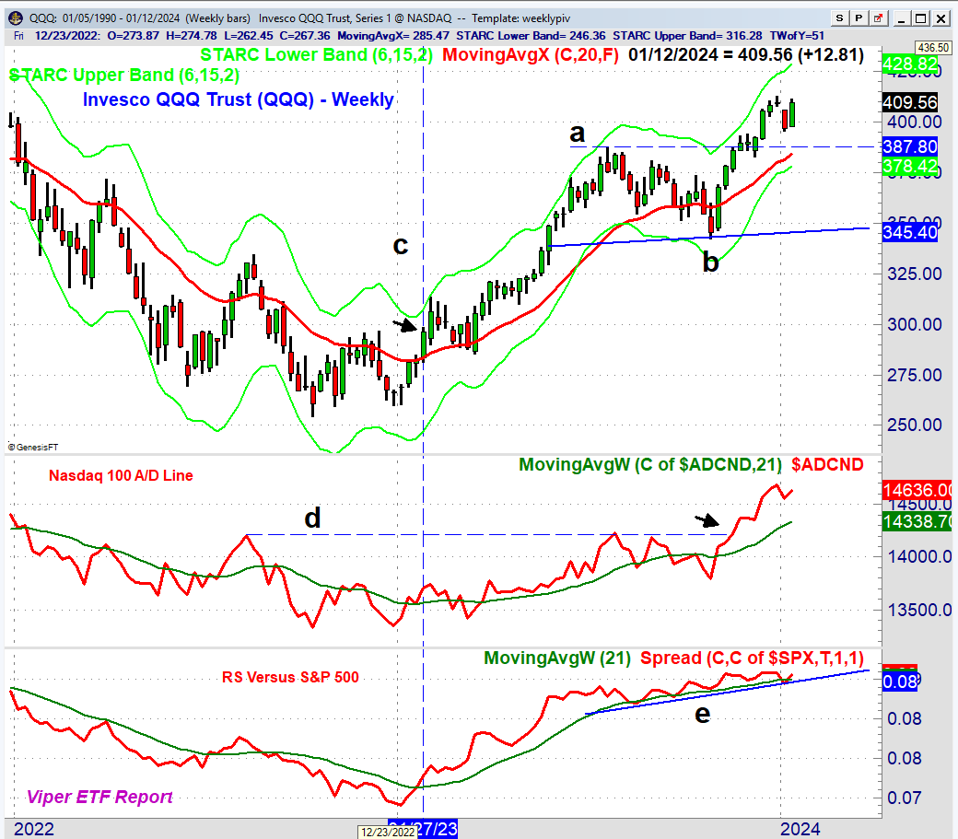
The 3.23% gain last week in the Invesco QQQQQQ Trust (QQQ) may have convinced some of the big tech bears that the growth rally was not over. The close was barely above the doji close from two weeks ago so another strong week would not hurt.
The recent trading range on the weekly chart, lines a and b, was completed in December and the width of the formation has upside targets in the $430-$435 area. The weekly starc+ band is at $428 and the strongly rising 20-week EMA at $384.81 is consistent with a positive trend.
The weekly Nasdaq 100 Advance/Decline broke out of its resistance, line d, one week ahead of prices and shows a strong weekly trend. The resistance goes back to 2022 so this is a good sign for 2024.
The relative performance (RS) indicated QQQ was a market leader on January 27, 2023. Since then it has periodically dropped below its WMA but was higher again the next week. It has support at line e.

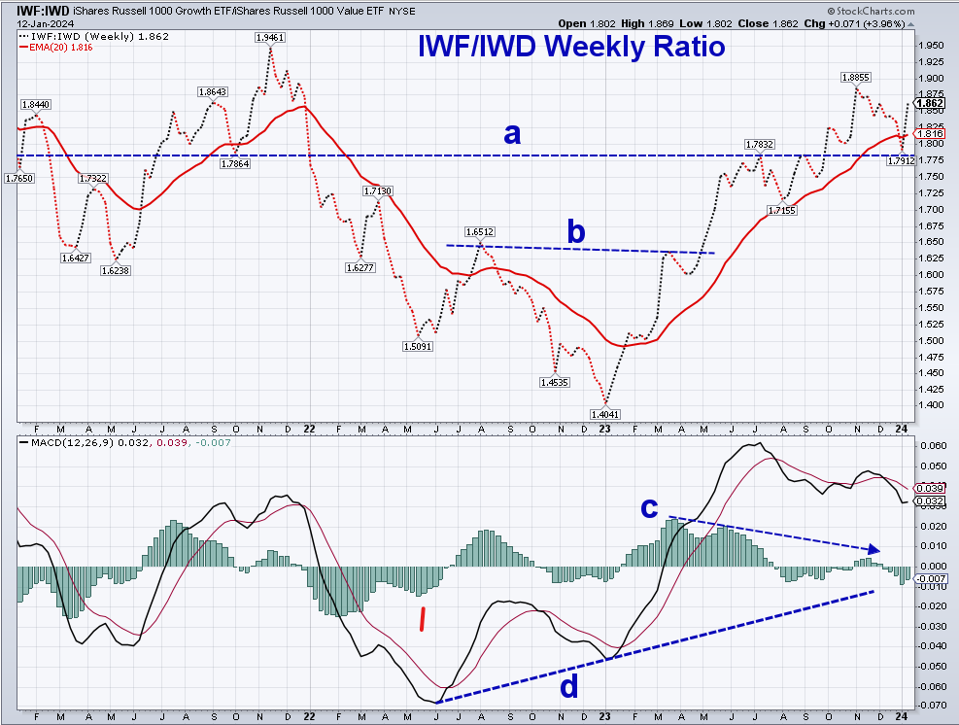
The weekly RS analysis for QQQ is consistent with my analysis of the ratio of the iShares Russell 1000 Growth (IWFIWF) to the iShares Russell 1000 Value (IWDIWD). The ratio topped at the start of November 2023 at 1.8855 as IWD outperformed IWF for the next seven weeks.
Last week IWF was up 3.66% while IWD was down 0.29%. The ratio jumped sharply above its 20-week EMA after reaching the support at line a. This keeps the trend positive and favors a move to the late 2021 high. The move in the ratio above the resistance at line b, in March was a bullish sign for growth.
The weekly MACDs and MACD-His are negative and will take at least a few weeks before they are likely to turn positive. The longer-term divergence, line d, is a bit more important than the recent negative divergence, line c.

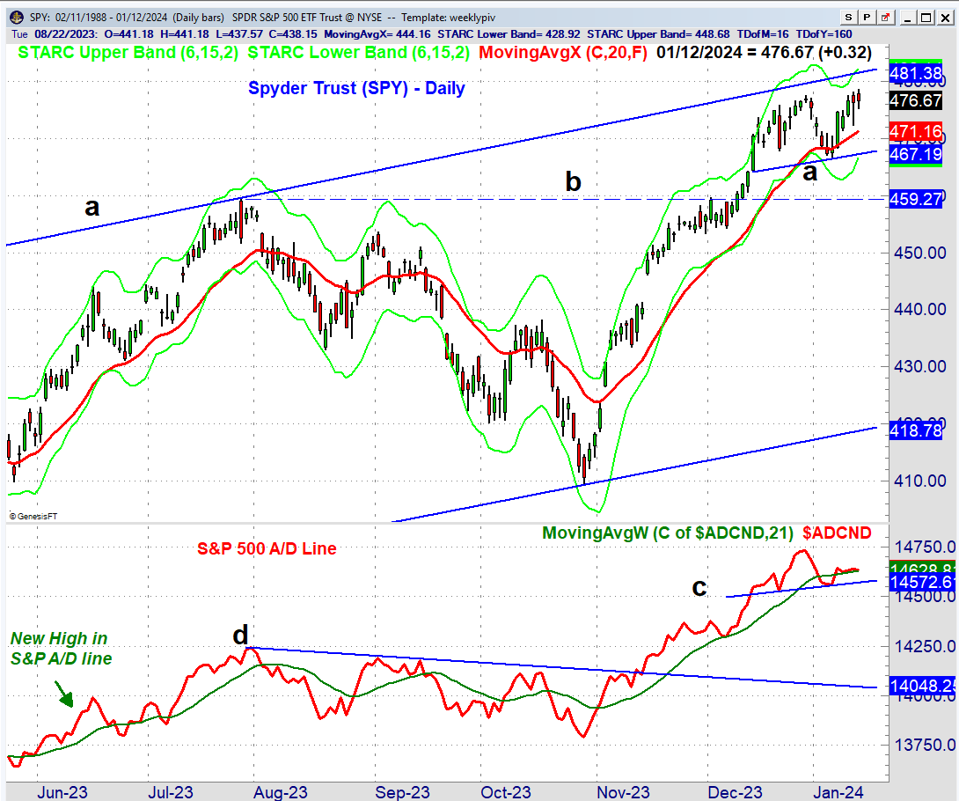
The daily chart of the Spyder Trust (SPYPYSPY) shows the recent three-week trading range that currently still allows for a correction over the near term. A decline below the support at $467.19, line a, will allow for a drop to the stronger support in the $459-$460 area, line b.
A further correction should be signaled by a drop in the S&P 500 A/D line below the support at line c. However, the fact that the A/D line has moved to further new all-time highs since the November breakout is a bullish indication for the future.
In my view, it definitively invalidates the current double-top concerns as it indicates that the SPY is stronger now than it was at the early 2022 high.
For those who are underinvested, I would not chase prices and focus on your entry levels. Traders look for pullbacks to the rising 20-day EMA. For ETF investors I would focus on the 20-week EMAs and/or the yearly pivots which will be discussed next week.
Comments
comments