Forbes.com February 25, 2024: So far in 2024 much of the debate amongst Wall Street analysts and market forecasters has been on many times the Fed would cut rates in 2024. In their December meeting, they forecast that they could cut rates three times in 2024.
That is when the fun began as a month later Goldman Sachs economists predicted a total of five cuts in 2024. Morningstar at the same time was predicting 6 interest rate cuts in 2024. At the time traders based on the CME FedWatch Tool gave a 73% chance that the Fed would cut rates in March.
The rate cut mania seemed to peak with a prediction of 9 rate cuts in 2024. The tone started to change in late January. At the January 31st press conference Fed Chair Jerome Powell said that a March cut is "probably not the most likely case."

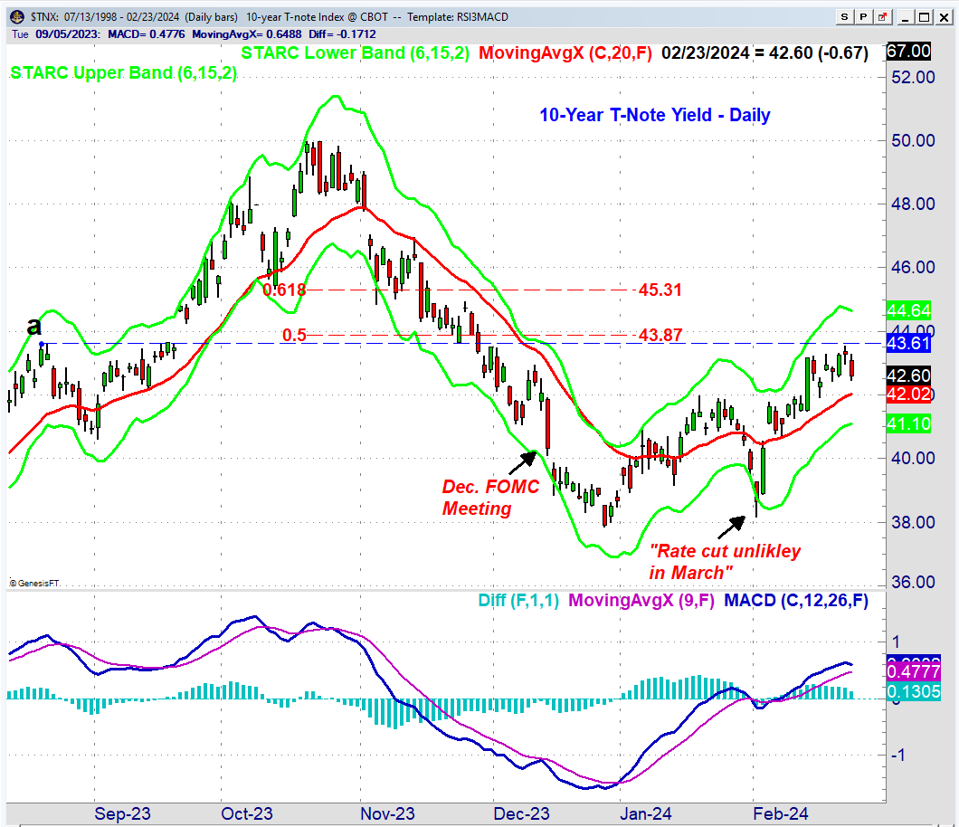
The 10-Year T-Note Yield dropped sharply in response to the December 13th FOMC meeting and declined for the next few weeks, bottoming at 3.875% on December 27th. Since the FOMC meeting the public forecasts for the rate cuts bidding war has continued. The low in yields corresponded with a short-term high in the Invesco QQQQQQ Trust (QQQ). At the start of January, yields opened higher and the daily MACDs both turned positive. Public commentary from Fed Governors and outside experts pushed back not only on how many rate cuts were reasonable but also when they might start.
The yield dropped sharply back to 3.817% and below the starc- band in reaction to Powell’s January comments that a March cut was unlikely. Since then yields have continued to move higher as they hit 4.354% on Thursday and reached the prior resistance level, line a. The 50% retracement level from the October 2023 high is a bit higher at 4.387%.
Of course, opinions on what and when the Fed will act have changed quite a bit. On January 24th the Fed Funds futures implied a 41% probability of a rate cut in March but that was down from over 80% a month earlier. Now Goldman Sachs is looking for the first cut in June and just four cuts overall. The economist who was looking for nine cuts in December is now looking for just two.
This example is another good example of why most investors and all traders should ignore most macroeconomic views. The inevitable recession forecasts in early 2023 I have been told kept some investors out of the stock market.
The past two months of Fed policy debate over the path of interest rates may have caused many to avoid some great investment opportunities. The technical methods discussed in my recent trading lesson I think can better identify the good times to buy or sell.

The daily chart of the 30-year T-Yield was sharply lower on Friday after closing above the resistance, line a, on Wednesday. The chart pattern (lines a and b) does look more like a pause in the downtrend from last year's highs than a bottom formation.
If that is the case then a close below the support at line b will project a drop below the late 2023 low in yields. The actual measured target is in the 3.720% area which was a bond yield last seen in the spring of 2023. The MACDs support this view as the MACD-His has been diverging from yields as it has formed lower highs, line b, and could turn negative early this week.
The chart and technical studies for the 2-year T-Note yield do look more positive as the yield has moved well above the December highs and could rally back to the 4.80-5.00% area. The MACDS are both positive and rising strongly. This indicates that while short-term rates move even higher the longer-term yields may not.
There are plenty of economic reports to move the markets this week including Durable Goods, Consumer Confidence, GDP, and the all-important PCE inflation report on Thursday. Some feel that because of the recent economic data this week’s PCE gauge will come in hotter than expected this week. Consumer Sentiment and ISM Manufacturing on Friday so buckle your seatbelts.

The Dow Jones Transportation Average recorded the best gain last week of 1.9% closely followed by the S&P 500 and Nasdaq 100 which were up 1.7% and 1.4% respectively. The Dow Jones Industrial Average was up 1.3% and the SPDR Gold Shares rose 1.2%. On a year to date (YTD) the Nasdaq 100 is leading but not by much.
There was very little red in last week’s market review as only the iShares Russell 2000 was lower and it is also one of the worst performers YTD. Though its performance this year has been poor it has stayed above long-term support.

The NYSE Composite finally closed last week above the early 2022 high, line a, as it gained 1.2%. The weekly starc+ band is at 17,807 and its performance over the past month is a sign that the rally is now including more stocks. Still last week 1675 issues were advancing and 1233 issues declining which is not as good as the price gains would suggest.
The NYSE Stocks Only A/D line has moved above the resistance at line b, and is well above its rising EMA. The NYSE All A/D Line has been a bit stronger over the past few weeks and has moved further above its breakout level, line c.

Even though the Invesco QQQ Trust (QQQ) was up 1.44% for the week it was down 0.29% on Friday after the sharp gap higher on Thursday. This creates a somewhat vulnerable short-term pattern that needs a higher close Monday. A drop below the 20-day EMA at $428.77 would be the first sign of weakness with more important support at $422.13, line a. A break of this level suggests that QQQ could at least test the December high at $412.92.
The Nasdaq 100 A/D line moved back above its WMA on Thursday but did not confirm the new closing high in prices. A drop below the recent lows will be consistent with a further correction. The on-balance volume (OBV) was not able to close above its WMA on Thursday and has now turned down. This is a sign of weakness.
It is likely to be an interesting week and while it is unlikely to change the intermediate outlook for two of my top four favorites, Technology Sector (XLK) and Communication Services (XLC) they may correct back to further support. I would expect some sectors to outperform on a further market correction.


