After a choppy week of trading stocks closed the week strong adding to the evidence that the upside reversal on January 21st was important. The surprising drop in bullishness the previous week (Is Bullishness Low Enough Now?) did not get the attention of most analysts even though it was making a ten year low.
According to AAII the bullish% rose to 29.75% last week after hitting a low of 17.9% on January 14th. The bearish% is back to 40% as it dropped 8.7% last week. The long term bullish average is 38.7% so a gradual rise back to this level would not be surprising.
The recent firming in stocks prices has not changed the bearish outlook of many analysts which is not surprising. Students of the markets may find last week's article "Learning From Past Bear Markets" informative as typically bear market rallies, as was the case in 2008, cause many of the bears to change their tune just before the market decline resumes.
It is still my view that the current market rally will determine whether we have just seen a market correction or the start of a near bear market. There are no convincing signs yet of a recession based on the economic data and most bear markets have coincided with recessions. This has some bearish markets calling for an "earnings recession" where a continued trend of weak earnings and revenues push stocks into bear market territory.
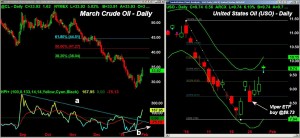
The fears over China's and the continued plunge in crude oil helped fuel the stock market selling at the beginning of the year . The recent rebound in crude oil has allayed some of those fears for now. There were signs as crude oil was plunging to new lows on January 20th that we were close to a bottom. The Herrick Payoff Index (HPI) had been diverging from prices, line b, and the strong close on Friday January 22nd confirmed that a rally was underway.
The continued strength in crude oil last week has been treated with distain by many media analysts but technically I think it can still go even higher. Though some longer term positive signs are emerging there are no clear signs yet of a major bottom. The action has created some good opportunities for ETF traders and the next pullback should create more opportunities.
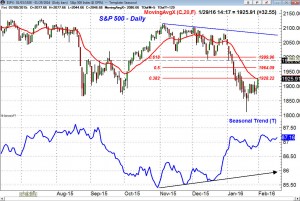
The daily chart of the S&P 500 shows that it has reached the 20 day EMA and the 38.2% Fibonacci retracement resistance of the decline from the November 3rd high. The 50% resistance stands at 1964 which is a reasonable upside target for the current rally. It would take a rally to the band of stronger resistance in the 1988-2000 area to get the attention of those on the short side.
The seasonal trend for stocks is positive until May though going back to 1950 the gains are just marginal in February. Going back over twenty years there have been January declines of over 5% in 2000, 2008 and 2008. In these three years stocks declined from 2-3.5% in February. The seasonal chart also shows that the S&P 500 typically top out in the first week of February and then is often under pressure for the rest of the month.
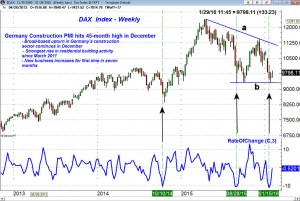
One of the positives for global stock prices may be the Euro zone markets as the Dax Index has held the lows from August-October (line b) and is now trying to turn higher. A strong move in the Dax back above 10,500 would be an encouraging sign.
The downtrend in the 10,450 area needs to be overcome to complete the flag formation. The Rate of Change turned up from oversold levels one week before the lows as was the case in October 2014. A strong rally in the Dax would be a sign that the worst of global stock market decline is over. Last spring the Dax topped out ahead of the S&P 500.
As noted on the chart the Markit Germany Construction PMI® for December was encouraging but more recent data from the Economic Sentiment Indicator reflects a sharp drop in January to 105.0 as it stood at 106.7 in December. That was well below consensus estimates but as I have always cautioned investors should not place too much emphasis on any one data point.
The Economy
There was a full slate of economic data last week and for a change some of the data on manufacturing was a bit more encouraging. The Dallas region is still bearing the brunt of low crude oil prices as the Fed Manufacturing Survey came in at a dismal -34.2 down from the prior months revised -21.6.
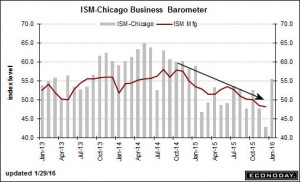
The Richmond Fed Manufacturing Survey was slightly positive while the Kansas City region is still quite negative because of oil prices. The big surprise was the Chicago PMI as it surged to 55.6 from 42.9 last month. This reflected strong orders with production at the highest level in a year.
The PMI Services PMI held firm in January as it was down just slightly from December while New Home Sales were up 10.8% in December and for the year had a gain of 14.7%. On the other hand Pending Home Sales were up just 0.1% well below the consensus estimate of an 0.8% gain.
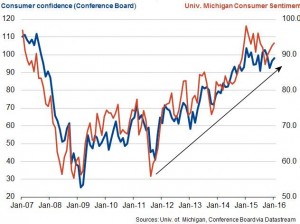
Durable Goods sagged in December falling 5.1% and the preliminary reading on 4th quarter GDP came in at 0.7% which was below the consensus estimate of 0.9%. Given the weak stock market many were concerned about the consumer but the Consumer Confidence rose in January to 98.1 up from 96.3.
The University of Michigan's Consumer Sentiment dropped slightly to 92 from 93.3 at the end of December. The chart shows that both measures of the consumer's outlook are still in clear up trends. Also on Friday the Employment Cost Index was up 0.6% which may be a precursor of long awaited wage inflation.
This week we get the ISM and PMI Manufacturing Indexes on Monday along with Construction Spending. On Wednesday we get new data on the services economy with the PMI Services Index and the ISM Non-Manufacturing Index. After Factory Orders on Thursday we get the widely anticipated monthly jobs report on Friday.
Interest Rates & Commodities
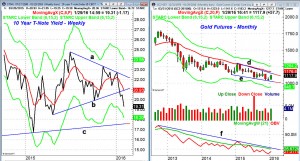
The yield on the 10 Year T-Note dropped sharply last week to close at 1.931% down from 2.048% the previously week. This was despite the fact that the FOMC showed little change in their stance on rates. The weekly support at line b, was decisively broken with next major support, line c, in the 1.760% area. I have been noting the negative momentum on yields for several weeks so the drop was not surprising.
The Comex gold futures finished the month up $57.70. The January close was above the doji high of $1088 which could that the trend is changing. The monthly downtrend, line d, is at $1155 with the declining 20 month EMA at $1176.
The volume increased In January but the monthly OBV is still well below its downtrend, line f, and its WMA. The weekly OBV just closed above its WMA on Friday but further strength is needed to suggest that gold has formed an important low. The gold miners are acting better.
Market Wrap
The surprising rate cut by the Bank of Japan boosted stocks out of the doldrums after the FOMC sell off. The market ignored the weak preliminary reading on 4th quarter GDP. The Dow Industrials gained 2.3% for the week which was much better than the 1.6% gain in the S&P 500. The Nasdaq Composite managed a gain of just 0.5% and the Nasdaq 100 dropped 6.8% in January.
This was considerably worse than the 5.1% decline in the S&P 500 as a host of technology stocks lost over 20% in January led by Autodesk (-23%) and Micron Technology (-22%). For the week 2370 stocks advanced with 845 declining.
Though Amazon (AMZN) was one of the big losers, dropping 7.6% on Friday there are some stocks that have performed very well. Two that showed up in my weekly scans as market leaders and were recommended in my Viper Hot Stocks were Constellation Brands (STZ) and Euronet Worldwide (EEFT). They were up 7% and 10% respectively in January.
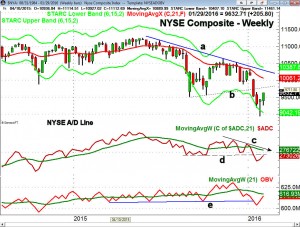
The weekly chart of the NYSE Composite shows the impressive 7.7% rebound from the low of 8937 on January 20th. The former support, now resistance at line b, is in the 9750-9800 area which is about 1.5% above Friday's close. The declining 20 week EMA is at 10,061 with the downtrend, line a, at 10,200. There is initial support at 9258 which was last week's low.
The weekly NYSE A/D line is still rising but is now back to resistance at line d. The A/D line needs to overcome the downtrend, line c, and the declining WMA in order to turn positive. The daily A/D line (not shown) is well above its WMA and could rally further. The weekly OBV is back above the resistance from 2015, line e, but is still below its WMA. The daily OBV is positive.
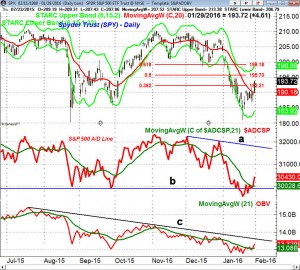
The Spyder Trust (SPY) closed well above the 38.2% Fibonacci retracement resistance at $192.21 with the 50% resistance at $195.70. The 61.8% resistance and the daily starc+ band are now at $198.86 to $191.18. There is weekly pivot resistance at $196.05 to $198.37.
The S&P 500 A/D line has risen back above the support from last summer's lows. The WMA of the A/D line is starting to turn higher but is not leading prices higher. The A/D line needs to overcome the downtrend, line a, to turn positive. This would take several more weeks. The daily OBV is in a short term uptrend but is well below the long term resistance at line c. The weekly OBV (not shown) is rising and now close to its flat WMA.
What to do? This may be an important week for the stock market as Friday's strong close should lead to further gains this week. The focus will be on the jobs report but if we see a very strong report like last month some may fear that the Fed is then more likely to raise rates in March. But what action if any should investors take?
A rally to the $195.50-$198 level in the Spyder Trust (SPY) still looks likely but very strong market internals are needed to push stocks to higher levels. The majority of traders are still looking for a break below 1820 in the S&P 500 so a rally that lasts longer would not be surprising.
Technically it seems as though the stock market needs more time to repair the technical damage so once the current rally tops out then the market could drift back towards the January lows. This could complete a more sustainable market bottom as there are no signs now that stocks are ready to accelerate to the upside.
There is no strong evidence that we are entering a recession. I would expect the economy and especially manufacturing to actually get better as we head into the spring. Those of you who followed my advice and did not sell in a panic last month now should decide whether their allocation to stocks is too high for you to sleep at night. If you were uncomfortable about your holdings during the market decline adjusting your portfolio might be the right idea. (I have been helping a number of clients with this process and if you are interested email us at wentworthresearch@gmail.com)
One of the largest mutual that does not track the S&P 500 is the Vanguard Total Stock Mkt Idx Adm (VTSAX) as it has total assets of over $400 billion. It has rallied 4.2% from its closing low but is still down 5.7% YTD even though it gained 2.6% Friday to close at $47.92. For those who want to shift some of their stock holding into cash you could use VTSAX as a guide and I think a rally back to $48.60-$49.80 is possible.
If my analysis is correct there should be signs of a completed market bottom later this quarter. I will be watching the rally closely and you can follow my comments on Twitter.

