Editor's note: If you like Tom's analysis,check out ViperETF.com, his premium newsletter.
Monday's overnight concerns over the downing of a Turkish jet triggered some early selling but the buyers stepped in after lunch as the Dow Industrials and &P 500 closed with minor gains. The Russell 2000 did much better as it was up 0.72% while the mid-cap stocks were not far behind. The futures are slightly higher in early trading.
The iShares Russell 2000 (IWM) has lagged the Spyder Trust (SPY) by about 2% since the late September lows . It was the weakest of the market tracking ETFs at the correction lows but from a technical standpoint the IWM started to look better at the end of the month. Strength in these stocks would be a positive for the market and would also erase one of common market concerns.
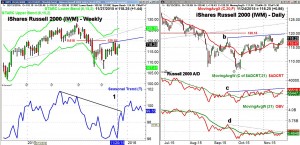
The weekly chart of iShares Russell 2000 (IWM) shows that it seasonal bottoms on November 20th, line 1, and the downtrend in the seasonal trend is broken in the middle of December. Typically the seasonal strength lasts until early January.
The IWM has been trading above and below the 20 week EMA for the past four weeks and it is now at $117.04. The 61.8% Fibonacci retracement resistance from the June highs is now at $120.15.
If it is decisively overcome then we should see a move to the $125-$127 area with the weekly starc+ band at $125.78.
The daily chart of IWM has resistance now in the $120 area, line b, with the former uptrend (dashed line ) at $123.50.
The Russell 2000 A/D line has moved further above its WMA but needs to surpass the resistance at line c, to generate a stronger buy signal.
The daily OBV has slightly broken its downtrend, line d, but a strong close on volume of over 42 million shares would be much more positive.
The daily relative performance (not shown) now appears to have bottomed consistent with a new market leader.
There is minor support now in the $115.50-$117 area and the monthly pivot at $113.20 held on the recent pullback.
What to do? New long positions in IWM were recommended to subscribers of the Viper ETF Report at $115.85 in late October. For those not yet long I would advise waiting for a breakout in the A/D line and/or a strong close above $120.25 before looking for a new entry.


1 thought on “Don’t Give Up On These Stocks”
Comments are closed.