The investor concerns about continued tensions with North Korea and the long term implications of hurricane Irma caused some investors to move to the sidelines last week. This did not change the positive technical development from the previous week but does allow for choppy trading in the week ahead.
The quick resolution of the debt ceiling issue with Trump joining the Democrats is a positive for the markets though it was a surprise to most. The yield on the 10 Year T-Note dropped to new lows for the year as important support was violated. This reaffirms the negative trend analysis and reverses any signs that yields could be bottoming.
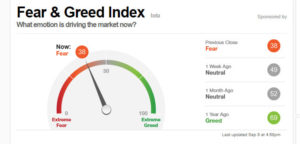
Bullish sentiment according to AAII rose 4.3% to 29.3% which was not surprising. It is still at relatively low levels with the bearish sentiment at 35.7% down 4.2%. The CNN Fear & Greed index is back to 38 (fear) as it was 49 last week (neutral).
The Nasdaq Composite and small cap Russell 2000 were hit the hardest last week as both were down 1% while the S&P 500 lost 0.60%. The Dow Transports and Dow Utilities bucked the trend as they gained 0.30% and 0.80% respectively. The NYSE Advance/declines were negative with 1227 stocks advancing and 1939 declining.
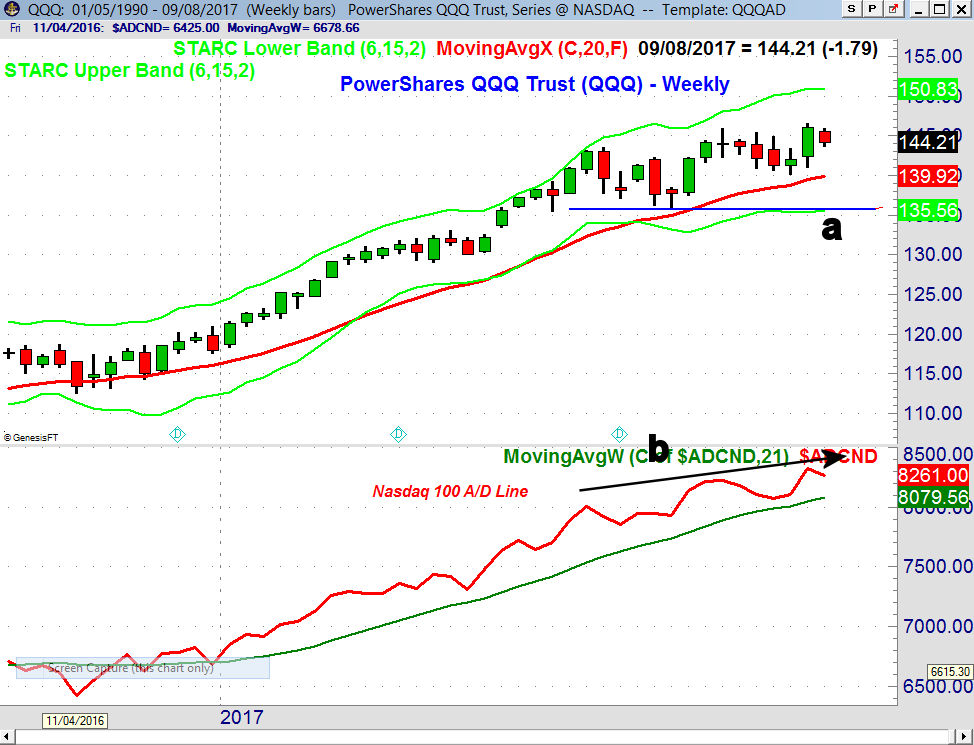
The stock market’s intermediate term trend remains positive as the weekly NYSE, S&P 500, Nasdaq 100 and Dow Industrials A/D lines all made new highs a week ago. The weekly chart of the market leading PowerShares QQQ Trust (QQQ) shows that it traded in a narrow range last week as it is holding well above the 20 week EMA at $139.92. There is major support, line a, in the $135-$136 area, line a.
A strong close above the recent high at $146.59 is needed to trigger a rally to the $148-$150 area. As I pointed out last week the weekly Nasdaq 100 A/D line made a new high as it shows a pattern of higher highs, line b. It turned down slightly last week. The WMA of the weekly A/D line is rising steadily which is also a sign of strength.
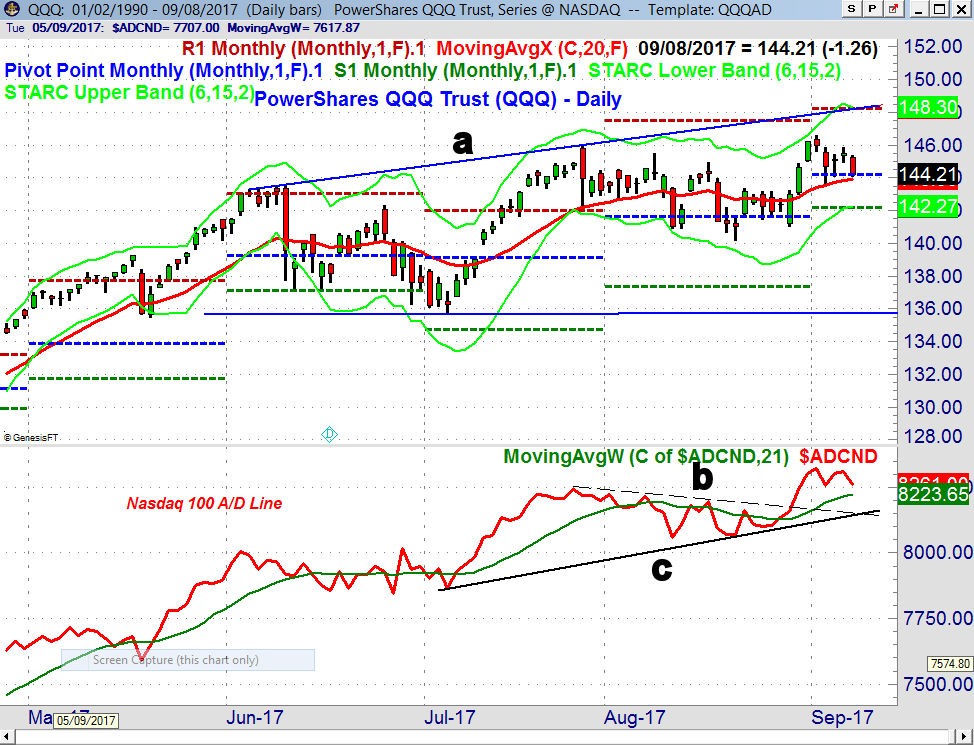
The PowerShares QQQ Trust (QQQ) closed Friday on the monthly pivot with the 20 day EMA at $143.04. Viper ETF traders bought the QQQ near Tuesday’s low. The daily starc- band and monthly pivot support are at $142.27 which could be tested this week. There is even stronger support in the $140 area. There is monthly pivot and chart resistance (line a) in the $148.30 area.
The daily Nasdaq 100 A/D line broke through its downtrend, line b, on August 30th. The A/D line is still above its rising WMA and there is converging support at lines b and c. A drop below the August lows would be negative.
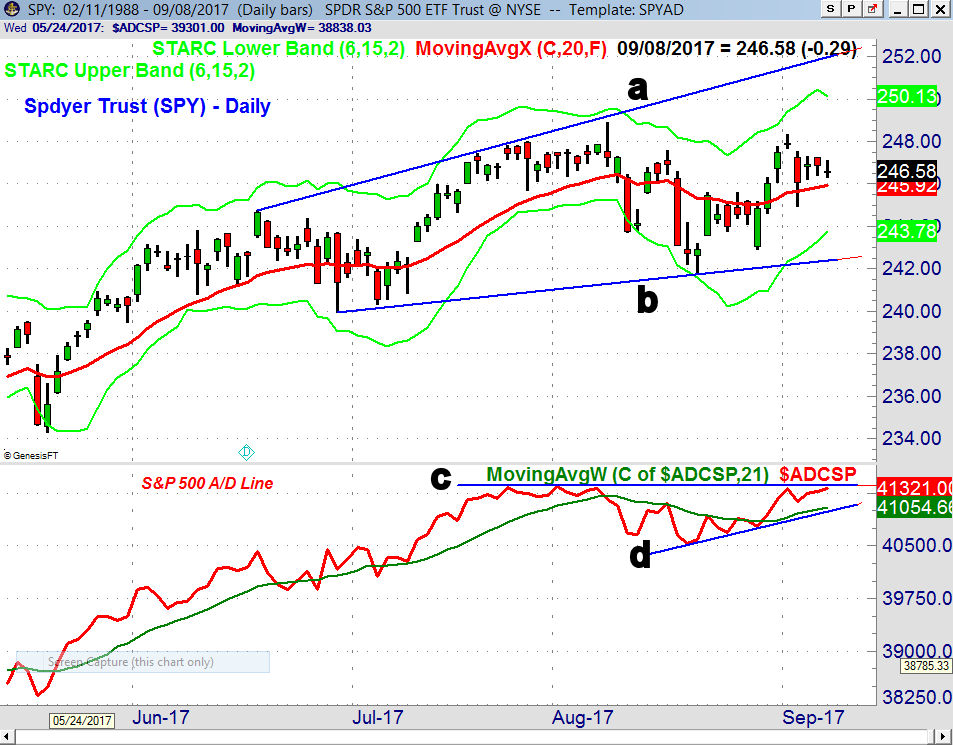
The Spyder Trust (SPY) formed a doji the day before the holiday weekend which set the stage for last Tuesday’s sharp market decline. On Tuesday the SPY dropped to a low of $244.75 which was below the 20 day EMA at $245.62.
By the close it had rallied to close at $246.08 and back to the monthly pivot. The daily starc- band is now at $243.78 with the monthly pivot support at $243.24. Once above the doji high at $248.33 the daily starc+ band and monthly pivot resistance are in the $250 area.
The daily S&P 500 A/D line is holding near the highs even though prices are lower. The daily A/D is still below its all-time highs, line c, but the weekly A/D line did make a new highs a week ago. The daily A/D is above its rising WMA and the support at line d.
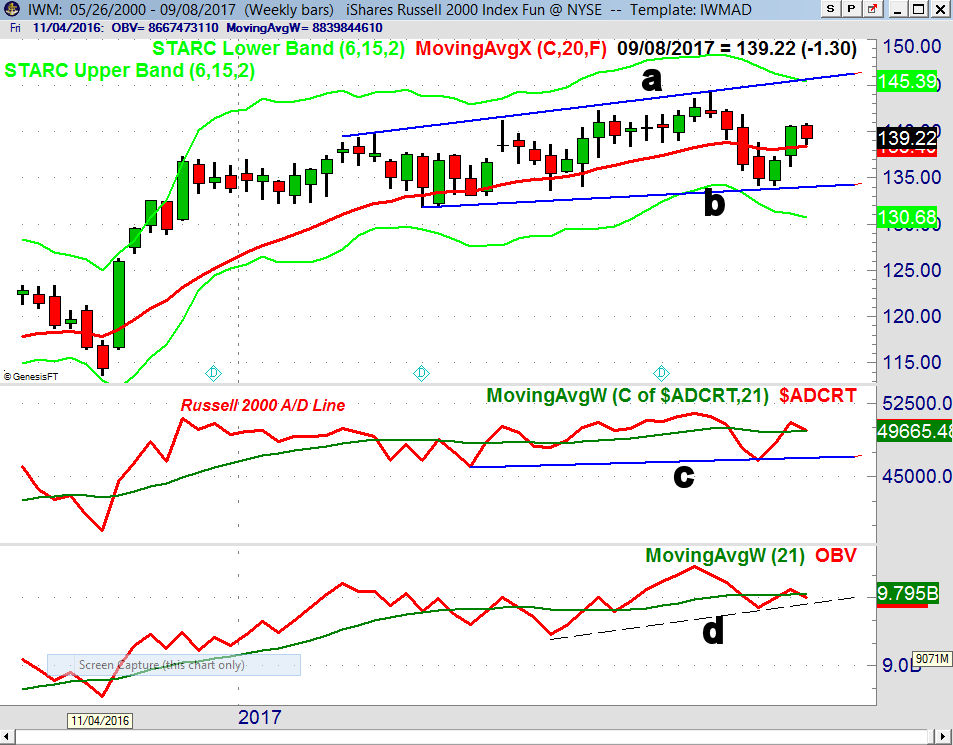
The iShares Russell 2000 (IWM) still looks the weakest of the major averages despite its sharp rally two weeks ago. It held above the 20 week EMA at $138.40 but was lower for the week. A break below the two week low at $136.23 will increase the selling pressure and suggest a test of the support at $134.14, line b. A daily close back above $140 would be positive.
The weekly Russell 2000 A/D line is barely above its WMA as it turned lower last week. The A/D line has strong support at line c. The weekly OBV has dropped back below its WMA with key support at the recent lows, line d. The daily A/D line is still positive as it is holding above its rising WMA and the daily OBV is also positive.
Only health care, oil & gas and the utilities closed higher for the week. The technology and basic materials were all down over 1.3% while the financials dropped 1.9%. The banks and other financial stocks continue to look weak as does the whole sector.
For the week we get the PPI and CPI data on Wednesday and Thursday. The Retail Sales, Empire State Manufacturing Survey, Industrial Production, Business Inventories and Consumer Sentiment all will be released on Friday.
What to do? The market decline last week did not reverse the positive signs from the previous week. It does suggests that this week may be a bit more difficult for those who are on the sidelines.
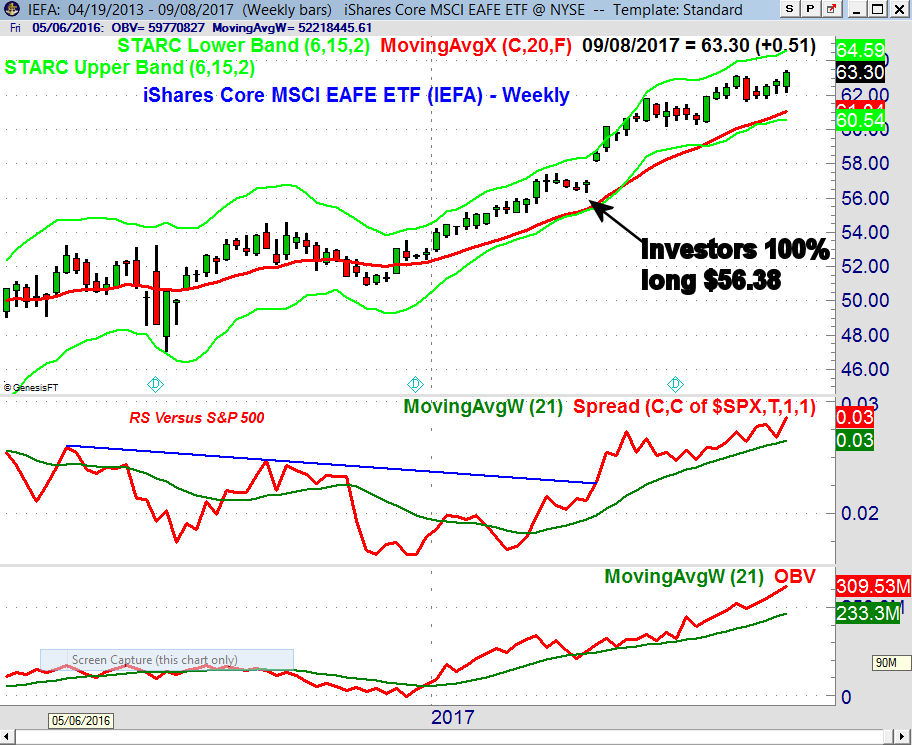
The correction last week does appear to be have been a good buying opportunity for traders as good support levels were reached. Some of the global ETFs look the best as the iShares Core MSCI EAFE ETF (IEFA) has been a Viper ETF favorite since early April when long positions were established. Traders added to their position last week and both the weekly RS and OBV have made new highs.
Viper ETF traders added a number of new long positions on last week’s pullback to support where well placed stops are able to control the risk. A strong rally early in the week with at least 2-1 positive A/D numbers will signal that the market’s rally has resumed.
It would take at least several down days with very negative A/D numbers to drop the A/D lines below good support.
Viper Hot Stock traders closed out most of the short positions on last week’s drop and added new long positions. In my weekly scan there were slightly more new buy than sell signals. Until there are stronger signs that the market is ready to accelerate to the upside I will be quite selective in adding new positions.
In my Viper ETF Report and the Viper Hot Stocks Report, I provide market analysis twice a week along with specific advice. I will also teach you about the markets for only $34.95 each per month.


