Many traders are tempted to pick bottoms or tops without clear evidence that a market has turned or a well defined entry as well as exit strategy.
Clearly the stocks in the energy sector have had a rough couple of years so there is much anticipation of an eventual turnaround in this sector.
The SPDR S&P Oil & Gas Exploration ETF (XOP) was down 29.4% in 2014 and is down 29.2% from the April high of $55.69. As a market is rallying it is important to be vigilant for signs that the rally is losing upside momentum. This is also true of a market that is in a protracted decline as the technical studies will generally give you clear signs that a market is bottoming.
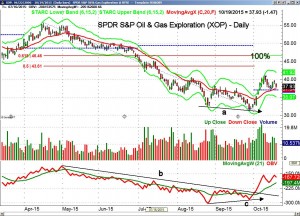
In the latter part of August XOP dropped sharply for five days as it made a convincing new low at $32.64 on August 25th. Though the volume was heavy on the decline it was even greater on the ensuing oversold rally as XOP bounced 17.6% in just three days.
This low then became an important level to watch as XOP again drifted lower in September and eventually made a new low at $31.64 on September 28th forming a doji. The lower lows on the daily chart, line a, suggested the downtrend was still intact. The next day XOP closed above the doji high thereby triggering a high close doji buy signal (HCD).
This new low in price was accompanied by lower volume than the August low. The lower level of selling was also confirmed by the on-balance-volume (OBV) as it formed higher lows, line c.
Just three days after the low the downtrend in the OBV, line b, was broken. This confirmed the bullish divergence in the OBV.
By October 8th XOP was testing its daily starc+ band (point 1) signaling that it had entered a high risk buy level. The initial correction took XOP down to $37.41 which was just over an 8% pullback from the high.
The rebound last week tempted some to buy but the corrective pattern did not yet look complete. The 3.7% decline on Monday indicated that the correction was not over.
The 20 day EMA at $37.34 and the minor 38.2% Fibonacci retracement support at $37.23 are not far below Monday's low. The more important 50% support is at $36.13.
So what are the potential profit targets for XOP once it completes its correction? The recent high at $40.80 just slightly exceeded the 38.2% Fibonacci retracement resistance from the April high at $40.75.. A next rally should take XOP above this prior rally high.
The 50% retracement resistance stands at $43.61 with the 61.8% resistance at $46.46. If the next rally is equal to the rally from the September 28th low to the October 9th high then the 100% or equality target is at $46.57 which is just above the Fibonacci resistance.
These potential targets can be very useful in determining the risk you are willing to accept on new long positions. I also use this type of analysis in determining the strike prices for vertical call spread positions.
What to do? Now that XOP is close to the 20 day EMA at $37.28 as well as the quarterly pivot at $37.04 XOP appears to be close to completing its correction. The current decline is viewed as a buying opportunity.


