Many years ago I was giving a presentation in Tokyo when a client gave me a copy of “Japanese Chart of Charts” by Sieki Shimizu. Candle charts soon became a part of my regular analytical routine and there is one formation that I have found to be especially valuable.
This formation is called a doji which is formed when the open and closing price are roughly the same. These are more valid when they occur on monthly or weekly data. When a stock forms a doji after a protracted rally it is sign of indecision and often warns of a price reversal.

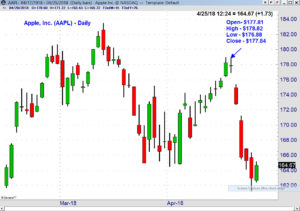
Here is just one example of the hundreds I see each month. Recently, Apple, Inc. (AAPL) formed a doji after rallying from $164.47 to a high of $178.94. AAPL gapped lower the next day as it opened at $174.95 down 1.6%. A close below the doji low will generate a sell signal and after a nice rally to resistance the formation of a doji is often a good reason to take profits. A few days later AAPL reached a low of $161.22 which was down 9.3% from the doji close.
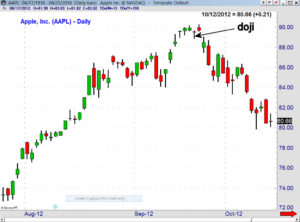
For those of you who think this is an isolated event – it is not. In some instances doji signals are generated on more than one time frame and multiple signals can be quite powerful. The action of Apple, Inc. (AAPL) in the fall of 2012 is another good example of why doji signals can be so important.

The daily chart of Apple Inc. (AAPL) shows that it formed a doji on Thursday September 20th 2012 with a low of $89.85 and a high of $89.67. Doji signals must be viewed in the context of the market’s recent price action. Apple had rallied over 36% from the late July low below $74 to above $90.
Therefore when AAPL closed at $89.67 on Friday September 21st those on the long side may not have been concerned but they should have been. On Monday September 24th AAPL gapped lower and closed at $88.48 below the doji low of $88.85. In just over two weeks AAPL had dropped 10%.

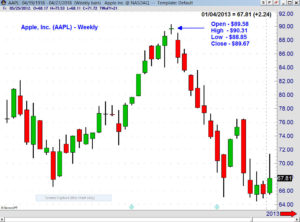
The weekly chart of AAPL shows that it also formed a doji the week ending September 21st with a high of $90.31 and a low of $88.85. The next week (ending 9/28) AAPL closed at $85.45 triggering a weekly doji sell signal. The chart shows that after the doji sell the rallies were very limited. By the end of 2012 AAPL had dropped below $65.
Each week in my Viper Hot Stocks scan I review over 150 high momentum stocks to determine which stocks have generated positive or negative weekly momentum. I also determine which stocks have formed dojis.

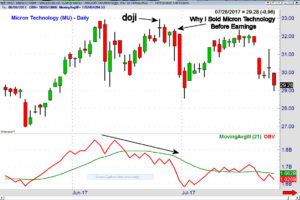
Last July I recommended that clients sell their position in Micron Technology (MU) on June 26th when it formed a doji. MU was reporting earnings later in the week. The reason for selling was discussed in my article “Why I Sold Micron Technology Before Earnings”. The declining trend in the on-balance-volume was also a sign that the rally was not sustainable. Two days later it had dropped 13.3% from the doji high.
This is just one of the techniques and trading tips that I discuss in my free Viper Report emails and I hope you will sign up now.


