
Given the recent increase in volatility the choppy action last week was not surprising. The sharp increase in bond yields last Tuesday has some of the bond gurus again warning investors about much worse times ahead. The FOMC and ECB minutes helped encourage nervous bond investors to sell.
The monthly chart of the yield on the 10 Year T-Note shows that the downtrend, line a, was broken last November. The chart is updated through June when the 20 month EMA was tested. The yield closed at 2.393% Friday with key resistance now at 2.621% which was the December high. The monthly MACD is still positive and favors higher yields but the weekly MACD has not yet turned positive.
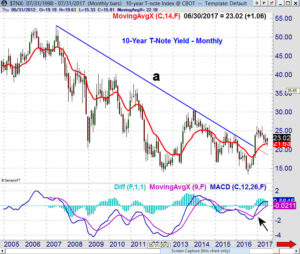
The bond market’s apparent concern is that there will be a sharp uncontrolled rise in yields. After what the central banks have been through since the recession I do not think this is likely. Should the economy start to overheat in the months ahead this might change but that would also be good for corporate earnings. Higher yields are not initially negative for stocks.
Jeffrey Gundlach, the CEO of DoubleLine Capital, again warned traders in June to raise cash as he is expected the stock market to drop this summer in reaction to the bond market. If this sounds familiar you might remember that he advised to “Sell everything” in July 2016 and buy gold.
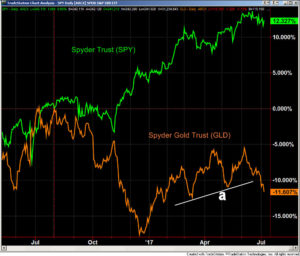
The percentage change chart since the end of July 2016 shows that the Spyder Trust (SPY) is up over 12% while the Spyder Gold Trust (GLD) is down 11.6%. Gold has had a rough week as GLD was down well over 2%. As I mentioned two weeks ago “the rally failures” do not look bullish. The break of support this week (line a) suggests it will move even lower.
At the end of last summer there were a large number of high profile analysts who were bearish on the stock market. Their views were discussed in “3 Investors Who Think a Stock Market Crash Is Coming” and along with Gundlach were Marc (We’re all on the Titanic) Faber and Jim Rogers. Mr. Rogers was looking for a “market crash of biblical proportion” ten months ago.
In a mid-June article on CNN they were joined by Bill Gross, Tom Forester and Peter Arnott. Based on my work there are no signs yet of an intermediate term correction like there was in 1987 or 2010 and 2011. A more severe correction than the current 3% decline in the Powershares QQQ Trust (QQQ) does seem likely before the end of the year.
When the S&P 500 declines 1% or more then I generally send a market comment to subscribers of either the Viper ETF or Viper Hot Stocks service. In part of Friday’s commentary I mentioned that “The CNN Fear & Geed Index dropped from greed (57) on Wednesday to slightly in fear territory (44) after Thursday’s close. There was little change in the AAII sentiment with 29.6% bullish and 29.9% bearish. Neutral % is still high at 40.6%.”
“There has not been any serious technical damage yet though all the A/D lines have turned down as the A/D numbers were 4-1 negative on the NYSE. There were a slightly more stocks making new lows but so far the new lows at 50 are not expanding.”
For the PowerShares QQQ Trust (QQQ) it “shows some signs of stabilizing with monthly pivot support at $134.79 which is 1.1% below Thursday’s close. A doji formed Thursday so a close above $137.06 on Friday will trigger a daily doji buy signal. “
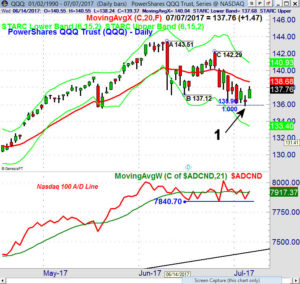
The chart as of Friday’s close shows that after the QQQ had been trading below its QPivot at $137.31 all week it closed Friday above it at $137.76. The daily doji buy signal was also triggered. Interestingly the chart shows that the A-B-C equality target at $135.90 was slightly exceeded on Thursday’s as the low was $135.80 (point 1).
The Nasdaq 100 A/D line held above the support at line a on last week’s decline and moved back above its WMA on Friday. The A/D line now needs to move well above last week’s high to indicate that the correction is over.
In Friday’s Wall Street Journal this article “Everything Is Awesome! Now Is the Time to Sell” caught my eye. (You may need a WSJ subscription to read the article.) The author James Mackintosh wrote for the FT Times before the WSJ.
I do not believe that his concerns over what he refers to as the Goldilocks economy is a reason to sell. He commented that “with global growth reasonable and little sign of inflation that might push central banks into a sudden market-squeezing monetary tightening.” I am quite sure that the central bankers who are students of history understand how such action would impact the financial markets.
My argument with the article is that he also uses the well-worn arguments that the bull market too old and too expensive so stocks are unlikely to go much higher. He does mention some of the contrary fundamental arguments but refuses to use any technical analysis.
Now his warning that you should not be complacent or greedy is something that I agree with totally. In last week’s post “Traders – Don’t Forget To Take Profits” that was also sent out to those on the free Viper Report email list I explained why I decided it was time to take profits on the remaining position in CBOE Holdings (CBOE).
In the article Mr. Mackintosh warns that “20% drops sometimes happen outside recessions, as in 1987 and 1966.” In past columns I have frequently pointed out the significant bearish divergences in the A/D lines that were evident before the 1987 top (see chart).
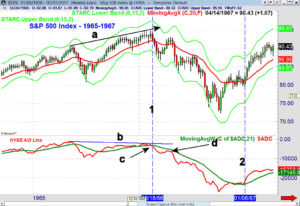
I was pleasantly surprised that the chart of the S&P 500 and the NYSE Advance/Decline line from 1966 there were similar warnings as there were in 1987. The S&P 500 made a high In May 1965 at 90.68 and then made a higher high, line a, in January 1966 at 94.64.
From the high to the October 1966 low at 72.28 the S&P 500 dropped 23.6%. The NYSE A/D line peaked in 1965 and then formed lower highs, line b, in early 1966. This bearish divergence indicated that at the 1966 price high fewer stocks were moving the market higher.
The NYSE A/D line dropped below its WMA (point c) four weeks after the high on February 18th, 1966. In April 1966 the S&P 500 rallied back to a high of 93.02 which was just 1.7% below the January high. On this rally the A/D line just rallied back towards it now declining WMA, point d, before it turned down. This was a classic sell signal as the A/D line did not formally bottom until January 1967, line 2.
In this bull market the first thing I do when I see a bearish article from someone I do not know is to search for their past market analysis. I look especially to see what they said about the market in 2013 as that was the best year in the bull market with the Spyder Trust (SPY) gaining 32.3%.
It was also the best trending year and you missed out on a significant opportunity if you were not in stocks. On December 12, 2012 my article “The Week Ahead: Stuff Those Stockings with Stocks expressed my bullishness as the A/D lines had just made new highs before stocks corrected sharply on fears of the fiscal cliff.
In my research I did find an article from March 12, 2013 where “James Mackintosh, in his daily column, The Short View, in the Financial Times, highlights that investors should not be looking at the bull markets that peaked in 2000 nor in 2007. Rather, he looks at 1987 as the best comparison to the current market.” At the time he was also concerned about stocks being expensive and that the economic recovery was already mature.
As I have in the past I encourage you to research the past analysis of those whose advice you are thinking of following. I know that investors and traders can become fascinated when they find a new analysts and can convinced to change their investment plan.
Specifically if someone is now negative on the market find out if that is a recent change in their outlook or have they had that opinion for several years. They are likely to right at some point as some who warned of the housing collapse were a few years early.
Sometimes it does take some time to find relevant articles. If you are interested in my market analysis there are over 1400 articles on Forbes going back to January 2011. If you clink on the archive link they are listed by month.
I hope you will be diligent in all facets of your investing or trading as that discipline will help you be successful. Be sure to use the research tools that are now at your disposal. It is truly amazing what you can find if you look hard enough. Recently I was telling a friend that I was fortunate enough at a young age to go to Scotland to play golf at some of the most popular British Open courses.
I mentioned that while we were at Gleneagles, a very posh golf resort, the Rolling Stones were also staying there as they did shows in Scotland. They definitely stuck out in contrast to the upper crust Scottish clientele. My friend seemed skeptical but I was able to find this photo for sale of them on the putting green (Mick sitting on the green). It not only convinced him but also brought pack some good memories.
The Economy
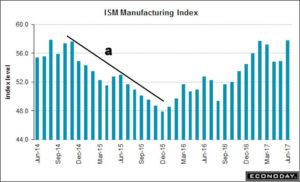
The week started off on a very positive note as the ISM Manufacturing Index came in at 57.8 which was much better than expected. All components look very healthy including new orders and production. The downtrend in the Index, line a, was broken in March of 2016.
The ISM Non-Manufacturing Index on Thursday at 57.4 was also better than expected as was the monthly jobs report which was well above expectations.
This week there are a number of Fed officials that are scheduled to speak and the Producer Price Index comes out on Thursday. It is followed by the Consumer Price Index, Retail Sales, Industrial Production and Consumer Sentiment on Friday.
Market Wrap
The stocks market managed gains last week but it was not easy after Thursday’s sharp decline The market was led higher again by the Dow Transports up 1.37% while the Dow Industrials were up 0.30%. The S&P 500 was only up 0.07% while the Nasdaq Composite gained 0.21%. On The NYSE there were 1418 advancing stocks and 16390 declining.
Financial stocks led the way up 0.75% followed by gains of 0.55% in the Industrials and materials. Tech shares also rebounded as the sector was up 0.52%. The energy stocks had not rallied with crude which made me skeptical and the oil & gas sector was down 1.5%. Viper ETF investors and traders bought the Vanguard Financial ETF (VFH) and the SPDR S&P Bank ETF (KBE) on the recent correction lows.
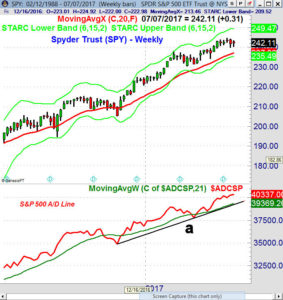
The Spyder Trust (SPY) held last week above the new QPivot at $239.77 which is a good way to start the quarter. (More on QPivots) For July the monthly pivot is at $242.26 with support at $239.54. There is monthly pivot resistance at $244.56 and then at $247.31 with the weekly starc+ band at $249.47.
The weekly S&P 500 A/D line made a new high last week and is well above support, line a, and it’s rising WMA. The daily S&P A/D line has been acting much stronger than prices as it made a new high last week and closed the week above its WMA. Traders are watching the chart support at $239.95 and $239.47.
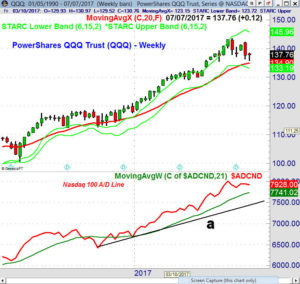
Just like on the daily chart the recent correction on the weekly chart of the PowerShares QQQ Trust (QQQ) looks fairly normal as it came close to the rising 20 week EMA at $134.90. After the Friday close above the QPivot at $137.31 the next resistance is at $138.76 and the 20 day EMA. The daily starc+ band is at $140.98 and a close above the prior swing high at $142.29 is needed to complete the corrective pattern.
The Nasdaq 100 A/D line is still well above its WMA and will look quite bullish with positive A/D numbers this week. A decline in the A/D line below the most recent low will be a sign that the correction is not over.
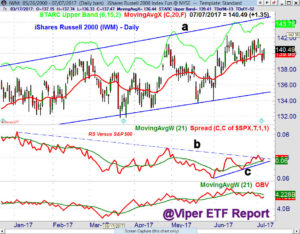
The iShares Russell 2000 (IWM) approached the all-time highs at $142.90 early in the week but then turned lower. It did firm Friday to close above the QPivot at $139.16. There is quarterly support now in $135.20 area where investors and traders are long. The daily relative performance (RS) still suggests that IWM is starting to lead the S&P 500. The RS is in a gradual uptrend (line c) and briefly broke its downtrend, line d, last week. It could confirm the bottom this week.
What to do? In last week’s column I discussed the Wall Street’s analyst who raised his target to 2700 for the S&P. I did not see anyone else raise their targets last week and in fact some of the high-profile market skeptics spoke out.
Based on the weekly relative performance and on-balance volume analysis the sector ETFs like health care, industrials and financials still look the best. There are several other sectors that are very close to resuming their major trends.
The next rally in the tech sector will be important as a good rally is needed to reassert the major trend. The A/D lines all continue to point higher and it would take several weeks if not longer before they could turn negative.
There are a few of the Viper ETF overseas and country funds that generated new weekly buy signals last week. Global markets generally outperformed the US in the 2nd quarter and I would not be surprised to see further rotations into these markets.
For Viper Hot Stock traders there was one new long and one new short recommendation last week. Traders also took a 15% profit in the remaining position in CBOE Holdings (CBOE).
If you are interested in specific buy and sell advice, you might consider a one-month investment of just $34.95 for either the Viper ETF or Viper Hot Stocks service. Both services include two in-depth reports per week and subscriptions can be cancelled online at any time.
If you are interested in learning more about my trading strategies, you can download a copy of my eBook and also be added to the list for the free Viper Report emails. Market commentary and technical tips are sent out several time a week. Additional market comments are often posted on the Viper Report Facebook page.


