The combination of plunging crude oil and fears over the Chinese economy has gotten the blame for the stock market's slide in 2016. The market decline has been the cruelest to the small cap stocks which have led the market lower.
At least on a short term basis the action last Wednesday was significant. As I noted in Thursday's morning article "with the Dow down another 500 points mid-session Wednesday stock holders are clearly past the white-knuckle stage. With just 116 stocks advancing and 3077 declining mid-day Wednesday the selling had clearly reached panic levels".
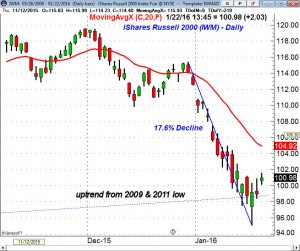
The action in the iShares Russell 2000 (IWM) was especially interesting. At the Wednesday's low of $95.06 it had dropped 17.6% from the high on December 30th. It did manage to close 4.6% above the day's low and back above the long term uptrend that goes back to the 2009 and 2011 lows.
With the continued strength on Friday IWM looks ready closed the week well back above $101. The next major resistance is in the $104-$105 area where the rally may end or could stall.
Crude oil had plunged below $27 on Wednesday, losing another 7% and contributing to the panic in the stock market. In Thursday's article "Time To Squeeze The Short Oil Speculators" my analysis of crude oil after Wednesday's trading indicating the odds of a short covering rally in crude oil were high.
Crude was a bit lower early Thursday in reaction to a bearish inventory report but soon turned sharply higher, moving back above the $30 level intra-day. In Friday's trading crude gained another 9% and settled 23% above the week's low. Energy ETFs like SPDR Oil & Gas Exploration (XOP) were strong as it closed up over 4% on the day.
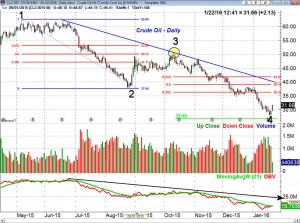
The daily chart of crude oil shows that the low Wednesday was very close to the equality or 100% target of $26.86. This was calculated by first measuring the decline from the May high (point 1) to the August low (point 2). A similar decline was projected downward from the October high (point 3) to get the downside projection at point 4.
It is important to note that crude oil's high on October 9th of $50.92 (point 3) was just above the 50% retracement resistance based on the decline from the May high to the August low. Rebounds within downtrends often top out between the 38.2% and 50% Fibonacci retracement levels.
The 38.2% retracement resistance stands at $36.34 with the 50% resistance at $39.14 so this zone is a potential upside target for a rally. Those on the short side are likely to get more nervous if March crude oil closes above $33.20. I think a further rally in crude will support a better rally in stocks than most are expecting and will give nervous investors an opportunity to reduce their equity exposure. (If you would like assistance with this process you might consider my mentoring service)
As I noted last week in "Is Bullishness Low Enough Now?" there were several signs that bullish sentiment had reached extremely low levels and that Wall Street was becoming uniformly bearish. In the latest AAII survey 21.5% are bullish which is up 3.6% while the bearish % rose 3.2% to 48.7%.
The market's rebound this week has not yet changed many minds on crude oil or the stock market. The rally in crude oil was credited to the winter storm that is hitting the East Coast on Friday and the hopes of more stimulus from world bankers . This of course totally ignores the actual market behavior and its classic reaction to the high short position in crude oil.
It will take more evidence from the stock market to suggest that the overall market correction ended last week as the slide in 2016 has caused significant technical damage. Because of that even if we see a much stronger rally it will be the market internals and volume that will tell us whether the long term trend is still positive.
Even if a stronger rally turns out to be part of a longer term topping process such rallies in the past have lasted long enough and gone high enough to reverse the too high bearish sentiment. As I will point out in an article next week the rally in the spring of 2008 lasted long enough to convince the majority of bearish analysts that the worst of the bear market was over.
The Economy
The economic gloom and doom increased further last week with several more analysts expressed their concerns and warned about a recession. The actual data last week was not too bad. The Housing Market Index did show some near term caution but the builders do remain bullish.
Also last week Housing Starts were lower in December but did show very strong gains in November. On Friday Existing Home Sales rose 14.7% which was just above the high end of forecast according to Econoday.
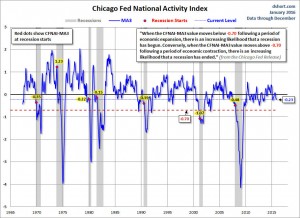
It was also slightly encouraging that the Philadelphia Fed Business Outlook Survey though weak at -3.5 does not seem to be dropping as fast. The Chicago Fed National Activity Index was not as weak as in November it came in at -0.22.
The an excellent chart and analysis from Doug Short shows the history of this indicator going back to 1970. He runs a 3 month moving average to smooth out the data. It is currently at -0.23 and his research indicates that "When the CFNAI-MA3 value moves below -0.70 following a period of economic expansion, there is an increasing likelihood that a recession has begun".
In the last two recession the drop below this level coincided with the start of the recessions. Also on Friday the PMI Flash Manufacturing Index improved to 52.7 from December's final reading. The Leading Economic Indicators (LEI) declined 0.2% in December as a result of declining housing permits and lower manufacturing order. As I discussed two weeks ago it has an excellent record of topping out well ahead of a recession so I will be watching it closely in the next few months.
On Monday we get the Dallas Fed Manufacturing Survey followed on Tuesday by the S&P Case-Shiller HPI and Consumer Confidence which will give us a good reading on what the consumer is thinking after the recent market decline.
The FOMC meeting also begins on Tuesday with a closely watched announcement on Wednesday afternoon. Also on Wednesday we get New Home Sales with Durable Goods on Thursday. Investors are likely to be watching the preliminary 4th quarter GDP on Friday as well as the Chicago PMI and Consumer Sentiment from the University of Michigan.
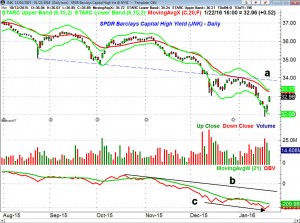
The yield on the 10 Year T-Note dropped to a low of 1.939% on Wednesday but then closed the week at 2.048$%. The weekly support in terms of yield chart has held but the weekly momentum is still negative. The SDPR Barclays Capital High Yield ETF (JNK) is down 4.3% YTD but has dropped 9.6% over the past three months.
On Wednesday the low was $31.88 just barely below the monthly S2 support at $31.89. On Thursday's close JNK closed above the doji high generating a short term positive signal. The 20 day EMA is at $33.26 with the daily starc+ band just a bit higher. There is further chart resistance at $33.50, line a. The rebound in junk bonds will help relieve some of the pressure on the stock market.
Market Wrap
Stocks were able to maintain their gains into the close on Friday which was an encouraging sign and the daily A/D numbers were quite positive with 2840 advancing stocks and just 341 declining. The weekly A/D numbers were positive for the first time this year as the NYSE Composite managed a 1.4% gain for the week as did the S&P 500. The small cap Russell 2000 showed a similar gain while the Dow Industrials were only up 0.70%.
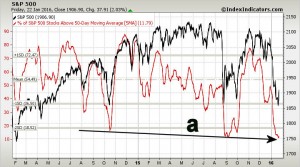
The % of S&P 500 stocks above their 50 day MA dropped to a low of 8.4% on Wednesday and it now looks as though the 5 day MA is ready to turn up this week. The chart shows that this MA has formed lower lows, line a, as it has reached levels that have coincided with sharp rallies in the past.
My stock scans last weekend revealed three new stocks picks and two of them STZ and EEFT did lead the market higher last week as they were only slightly lower during Wednesday's market plunge. I will be spending Sunday reviewing my scans for new buy candidates that will be included in Monday's Viper Hot Stocks report.
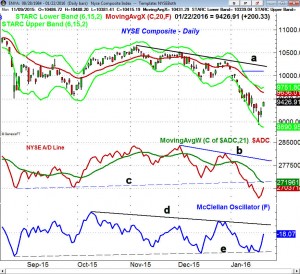
The daily chart of the NYSE Composite shows the up gap opening Friday after dropping below the starc- band on Wednesday. The 20 day EMA at 9636 is the next likely upside target with the daily starc+ band at 9751. There is more important resistance at 9880 with the quarterly pivot at 10,100. The downtrend, line a, is now in the 10,300 area.
The daily NYSE A/D line has turned up but has next resistance at line c, and its WMA. The A/D line needs to overcome its downtrend, line b, to confirm that the market has made a significant bottom. A close back below 9100 will return the focus on the downside.
The McClellan oscillator did not drop below the August lows (line e) so it has formed a potential bullish divergence. The oscillator has turned sharply higher and should move above the zero line this week. There is key resistance at the downtrend, line d.
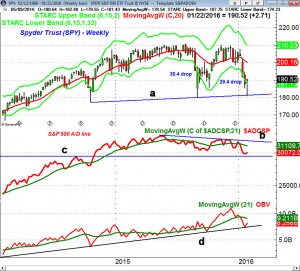
The Spyder Trust (SPY) dropped to a low of $181.02 on Wednesday which was just above the August low of $180.38. The weekly support at line a was tested. Though the recent decline likely seems worse to many the SPY dropped 30.4 points to the August low and as of Wednesday low the drop has amounted to 29.4 points. The long tail on the weekly chart is similar to what occurred at the August as well as the October 2014 low.
There is next resistance at $191.60 and then at the $194.80-$195 area. A weekly close back above this level would get the market's attention. There is longer term resistance in the $198-$200.
The PowerShares QQQ Trust (QQQ) was up 2.8% for the week as it dropped briefly below the September lows as the weekly pivot support at $94.50 and weekly starc- bands were violated. The daily relative performance turned positive on Friday suggesting it may lead on the rally. It's largest component Apple, Inc. (AAPL) reports earnings after the close on Tuesday. There is a band of strong resistance in the $105.60 to $107.50 area.
What to do? The mid-week reversal give investors such much needed relief but how long will it last?
As I expected last week the S&P 500 support in 1857-1867 area was broken last week with the low at 1812.29. So far the short term rally does look pretty strong and the heavy, panic selling last week does suggest we will see a rally that goes further and lasts longer.
The prevailing wisdom from the financial pundits is to sell on a rally but most are looking for the current rally to top out soon and not go much higher. I think a more complex 2-3 week rally is a clear possibility. A short term pullback from the $193.50-$195 is likely to set the stage for a rally to the $198-$200 area.
Though the recent drop does not seem like the first phase of a new bear market those who have now decided that they are too heavily invested in equities should consider reducing their equity exposure on a rally.
Because Wednesday's drop was so severe there were no new buy signals until Friday's close. There should be some short term opportunities for traders on the long side this week in technology, health care and consumer staples. If you want specific entry/exit advice on ETFs you might check out the Viper ETF Report .

