The stock market was hit mid-week by a heavy wave of selling as traders pointed to the failure of the S&P 500 to surpass the resistance at 1950 as one of the reasons that the market was going to move lower. This was based on the Wall of Worry - earnings, economic concerns and of course plunging oil prices.
Tuesday's article " Don't Follow Those Bearish Traders" was misunderstood by some readers who thought that I either did not believe in the profit potential of bear markets or that I was trying to paint the Fast Money traders in a bad light.
I have done extensive writing about bear markets including the June 2008 article where the evidence concluded that the bear market rally was over and that stocks were going to move lower. Since I have been analyzing the markets professionally since 1982 I have also had my share of wrong market calls and therefore never point out the bad calls of other traders.
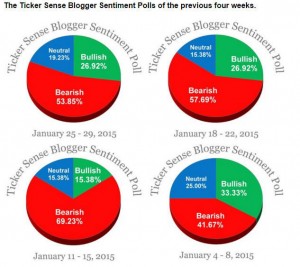
The article was written to emphasize that when a group of traders have a uniform opinion that is contrary to the the technical outlook investors and traders should learn to not follow the crowd. Gauging trader sentiment is not easy though Ticker Sense does a weekly survey of the 30 day S&P outlook of some widely followed financial bloggers.
The January summary revealed that the bearish sentiment peaked at over 69% a week before the January low on January 22nd and at 53.8% was still quite negative at the end of the month. In the February 12th survey 56.5% were still bearish and only 17.4% were bullish as the market was making its recent low.
As I also noted Tuesday " Put/Call ratios Monday revealed that SPX put volume was 1.7 times the call volume and the VIX Put/Call ratio was almost 3.00. This data was another sign of the trader's high bearish sentiment as most who were buying VIX calls were looking for it to rally and for the stock market to move lower.
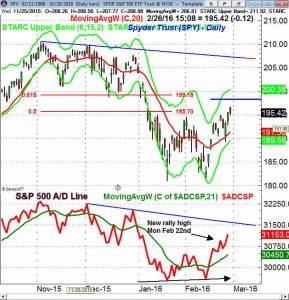
As stocks dropped more sharply than I expected on Tuesday and early Wednesday the put buying was even heavier. This was contrary to the fact that after Monday's close the S&P A/D line was "now rising very sharply as it has moved well above the early February highs."
This was a sign that that the S&P 500 should also move above its February highs. The SPY did overcome the key resistance at $195 on Thursday. As we approach the close on Friday the SPY looks ready to close lower. The monthly pivot is at $198.40 and a close above $200 would get the market's attention. The A/D line made further new highs at the end of the week and the market internals were positive again on Friday.
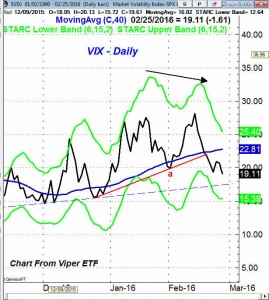
The VIX index, as I also pointed on Tuesday, had also broken key support (line a) which was a positive sign for the stock market. There were signs based on my analysis that the VIX was peaking on February 11th. The VIX is now in a downtrend with next good support in the 15.50-17 area.
In last week's column I looked at three sentiment measures that investors can follow to determine when the recently high bearish sentiment has dissipated. According to AAII the % of bullish investors rose 3.6% to 31.6% but is still below the long term average at 38%. The bearish % has dropped about the same amount and is now at 31.4%. The CNN Fear and Greed Index has risen from an extreme fear reading at the market lows to 57 which is now slightly in greed territory. It was at 78 a year ago.
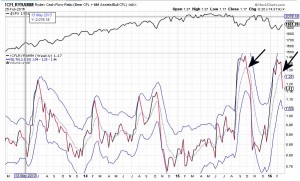
I also am monitoring the Rydex cash Flow Ratio as there were signs that there had been too much money flowing into the bear funds and that it was time for it to reverse. It has now dropped below its SMA which is similar to what occurred as the rally progress last October.
The Economy
The relatively lackluster earnings season has increased many investor's fears over the health of the economy as stocks were sold as prospects of strong earnings were low as the year started. In a December 29th article the WSJ noted that "Bonds Signal Unease Over U.S. Economy".
The economic reports in early 2016 supported a cautious if not a negative outlook on the economy as several often quoted analysts felt that we were already in a recession. The weak data and recessionary comments spurred even more selling in the stock market .
According to Lipper for the week ending February 24th " U.S.-based stock funds posted $2.8 billion in outflows during the week ... this adding an eighth week to the funds' streak of outflows." This was an improvement over the $5.7 billion that was taken out the previous week. This is anotehr sign of the high level of bearish investor sentiment.
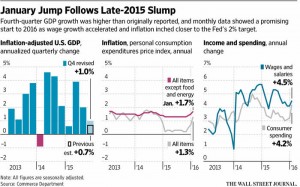
Therefore Friday's headline "U.S. Economy Starting 2016 on Solid Footing" was likely a pleasant surprise for many investors. The GDP came in better than expected for the 4th quarter at 1.0% as most were expecting a 0.4% gain. From my standpoint the most encouraging data was on inflation and consumer spending.
The core PCE now shows a year over year rate of 1.7%. It is now getting close to the Fed's target rate of 2.0%. The data on wages and salaries also has also shown a nice bounce which was long overdue. Though increasing inflation is not pleasant for bond holders since it will give the Fed more room to raise rate. I believe a gradual increase in inflation is what the economy needs to get even stronger .
Durable Goods were also strong on Thursday up 4.9% which was the best reading since last summer. The Chicago Fed National Activity Index came it at 0.28 while most were looking for a reading of -0.34. The flash Purchasing Managers' Manufacturing Index came in at 51 just above the all important 50 level.
The services sector sent a cautionary note as last Wednesday's flash PMI services index dropped below 50 which was the weakest reading since October 2013. This will mean that this Thursday's PMI Services Index and ISM Non-Manufacturing Index will now be watched more closely.
I have been commenting on the weak manufacturing data since last summer and on Monday we get the Chicago PMI and the Dallas Fed Manufacturing Survey. This is followed on Tuesday with the PMI Manufacturing Index and the ISM Manufacturing Index with Factory Orders are out on Thursday. Clearly over the next few months we will need to see more improvement in manufacturing before we head into the summer months.
We also get Pending Home Sales on Monday. Last week the S&P Case-Shiller Home Price Index was up 0.8% while Existing Home Sales rose 0.4%. New Home sales were down 9.2% as the sharp decline in the West dragged the numbers lower.
The focus this week as it is at the start of every month will be Friday's monthly jobs report. The all important LEI which normally tops out well before the start of a recession is sill in an uptrend. Therefore in my view investors should not worry now about an imminent recession.
Interest Rates & Commodities
The yield on the 10 Year T-Notes bounced last week closing over 3% higher. As I noted in January the weekly momentum had turned negative consistent with lower yields. There are no signs of a change in the weekly trend while the daily analysis does allow for a rebound over the next few weeks. This could take some of the pressure off the stock market.
Several weeks ago I pointed out the top in the dollar index which I felt would eventually be a positive for the stock market and the economy. The dollar has rebounded from my initial downside targets but I think that the current rebound is likely to fail in the next few weeks. This should have an impact on both the precious metals and crude oil.
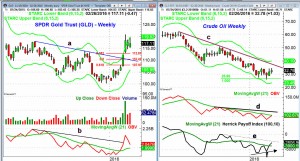
The precious metals have had a good run to start off the year as the SPDR Gold Trust (GLD) as well as the Market Vectors Gold Miners (GDX) surged well above their weekly starc+ bands three weeks ago. This was a sign that both were in a high risk buy area and Viper ETF clients closed out positions in a GDX call spread for over a 60% profit.
Both reversed last week and still closed lower. Bullish sentiment has reached very high levels which does make a further pullback quite likely. The 38.2% support for GLD is at $112.87 with the 50% support at $110.42. A drop to this level would also mean a retest of the breakout level at line a. The weekly OBV has moved through strong resistance, line b, which is a positive sign. The OBV should pull back to its WMA on a correction.
The continued decline in crude oil prices and the potential impact on many of the large banks is still one of the largest concerns of both investors and traders. The announcement from J.P. Morgan Chase (JPM) last week that they would add $500 million to the reserves for exposure to oil and gas loans added to the selling pressure in the stock market.
This was a shock as it was not mentioned when they reported recently reported earnings. Also the market was shocked by comments that the reserves would need to be raised to as high as $1.5 billion if crude stayed near $25 for eighteen months. I am looking for a significant low in crude oil this year. I do not think investors need to worry about permanently lower crude oil prices and their possible impact on the financial stocks.
The negative sentiment on crude oil is still quite high but so far rallies have been unable to surpass the early January highs near $35. The weekly downtrend, line a, is now at $36.50. The weekly continuation contract for crude did reach my downside equality target at $26.86 with the weekly starc- band at $23.46.
The weekly OBV has turned higher but is still below its WMA and the resistance at line d. The weekly HPI does appear to be bottoming as it has formed a bullish divergence, line f. A move in the HPI above its downtrend, line e, would support the bullish case. Crude reversed on Friday and closed on the lows. I will be watching the action for confirmation of a bottom
Market Wrap
It was the second straight week of gains in the major averages as the Dow Industrials and S&P 500 managed gains of 1.5% and 1.6% respectively while the Nasdaq Composite was up close to 2%. The beaten down Russell 200 was up over 2.6%.
More importantly there were 2358 stocks advancing for the week and just 833 declining. In last week's commentary it was my view that the market needed further strength this week to support the positive outlook and to validate our recommended long positions in those market leading sectors.
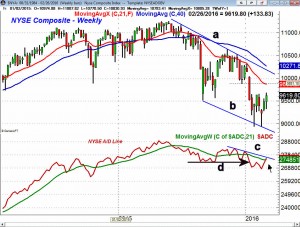
The weekly chart of the NYSE Composite still shows a well defined downward trading channel, lines a and b. The key short term resistance is still at 9865 which corresponds to the 20 week EMA and the late December lows. There is much stronger resistance in the 10,100-10,300 area.
Most importantly the weekly NYSE A/D line (One Indicator Stock Traders Must Follow) has moved back above its WMA for the first time since the start of the year. A higher close this week could move the A/D line through its downtrend, line c, which would be a sign of strength. However the A/D line does need to move above the late December high in order to reverse the negative trend that was triggered when the important support (line d) was broken.
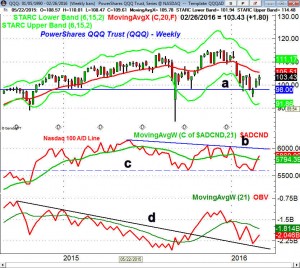
The technical outlook for the PowerShares QQQ Trust (QQQ) has also improved as it gained 1.7% last week after breaking the long term support, line a, just three weeks ago. The 20 week EMA is now at $105.51 and a close above this level should signal a move to the $108.50-$110 area.
Even though the QQQ did break important support the Nasdaq 100 A/D line was able to hold its support at line c before turning higher. The A/D line has now moved well above its flat WMA and a move above the resistance ( line b) would be a positive sign for the intermediate term trend. The weekly OBV has turned up but is still in a downtrend and below its WMA.
What to do? In addition to the economy, crude oil and earnings the other main concern for investors is the potential impact of further weakness in China's economy. In an interesting New York Times artcile last week " Peering Through the Haze of China’s Economic Data" many leading economists expressed their distrust over the reliability of China's economic data.
I continue to believe that China, like crude oil and fears of a weak economy should not be a major concern for US investors at this time.
The swings last week demonstrated that the market was still being buffeted by the battle between the bulls and the bears. Another strong close above in the S&P 500 above the 1950 level will provide more evidence that the bulls are back in charge.
In order to support my currently favored scenario that the January drop was a bull market correction the market needs to stay strong in terms of the A/D ratios. This would push the A/D lines further above their WMAs and move them to more important resistance.
There are a number of stocks that are acting quite well based on the weekly technical studies and will be concentrating on the long side this week for clients of Viper Hot Stocks.
Those that are looking to reduce the stock portion of their portfolio after the January plunge should have the ability to further adjust their stock holdings as we approach the 1990-2000 level in the S&P 500.

